Section 7.5 – Tasks
Various auditorial and management tasks has been performed in the laboratory throughout my 4 years. These include but are not limited to:
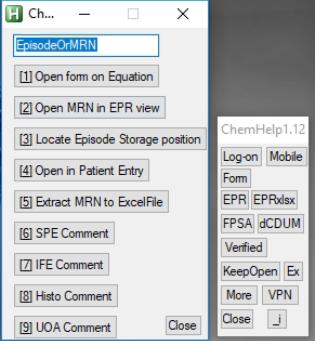
- ChemHelp – A script (program) which helps reviewers with the signing of blood results. It consists of various hotkeys, hotstrings and a few buttons which has evolved as our “right hand” when reviewing blood results at Groote Schuur Hospital NHLS. On face value it appears as a small petit application which runs alongside TrakCare, but the time saving is likely to be quite significant. This will likely be a nice additional audit – another project which could be taken on later. Unfortunately the descriptions of the functions of this script goes beyond the scope of this section, so please refer to Section 9.2.4 – ChemHelp SOP or visit: github.com/dietervdwes/ChemHelp (hyperlinks unfortunately are non-functional in a combined and printed PDF).
2. Data extraction tasks for projects and audits – Apart from being involved in an audit in our laboratory, I have been involved in assisting with data extraction via TrakCare’s Results Listing interface. Additionally, I have written a JavaScript extraction tool which has been used (and are being used) in a few studies currently. I have also incorporated into ChemHelp (see above) an automation tool for data extraction via TrakCare’s Results Listing interface. See Section 9.2.
3. Management and advisement of some pre-analytical aspects are sometimes required. As registrars we need to advise and help improve pre-analytical staff’s knowledge through assistance with routine test request queries. We also have a programme where the registrar’s do what we call a “Tech Talk”. These are mainly aimed at technologists but I have also given a talk to an audience including pre-analytical staff on aspects like sample delay, hemolysis and the effect thereof on HIL-indices.
4. Setting up of a referral system – I have set up a referral system for urine steroid profiles in our laboratory. I was involved in identifying the referral lab, setting up the billing codes on TrakCare, with Dr. Heleen Vreede and setting up the canned comments for recording of the results. Invoicing also caused some problems which we had sort out.
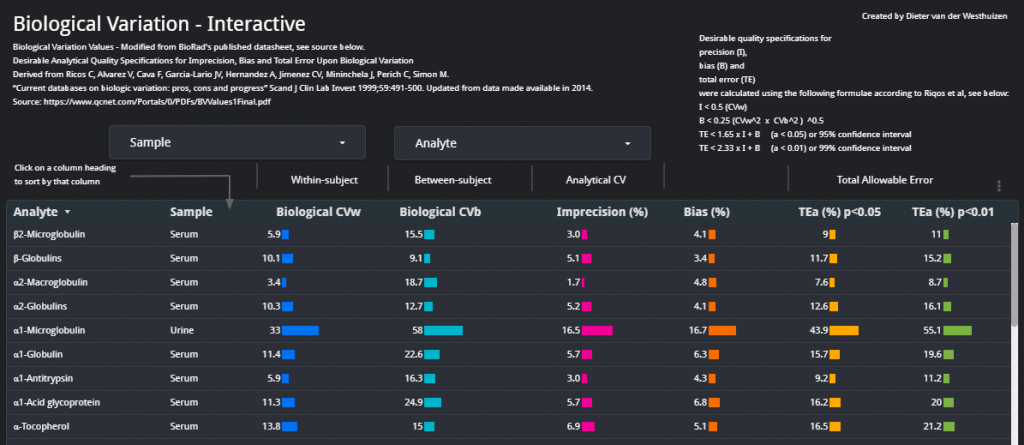
5. TEa Dashboard – I have taken the data from the Riqos et al. study on Biological Variation (updated in 2014) and made an interactive dashboard which we can use when reviewing QC. This dashboard assists in quickly viewing the data visually in a quick-to-access Google Data Studio Dashboard.
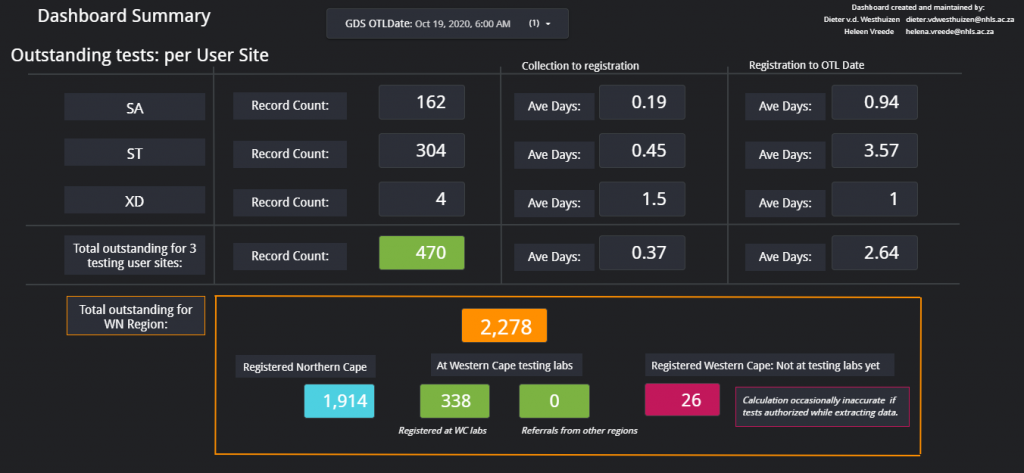
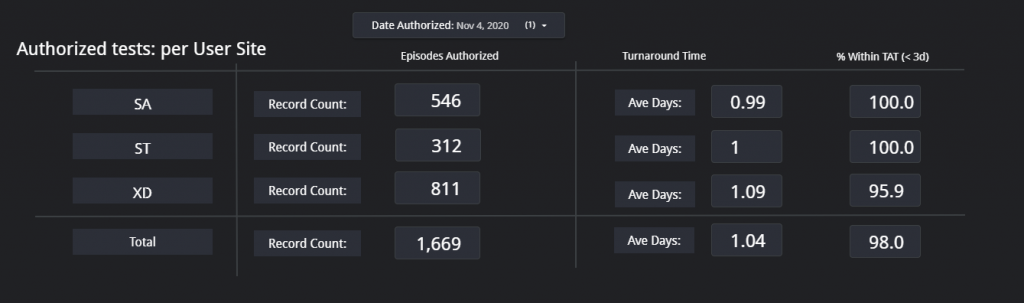
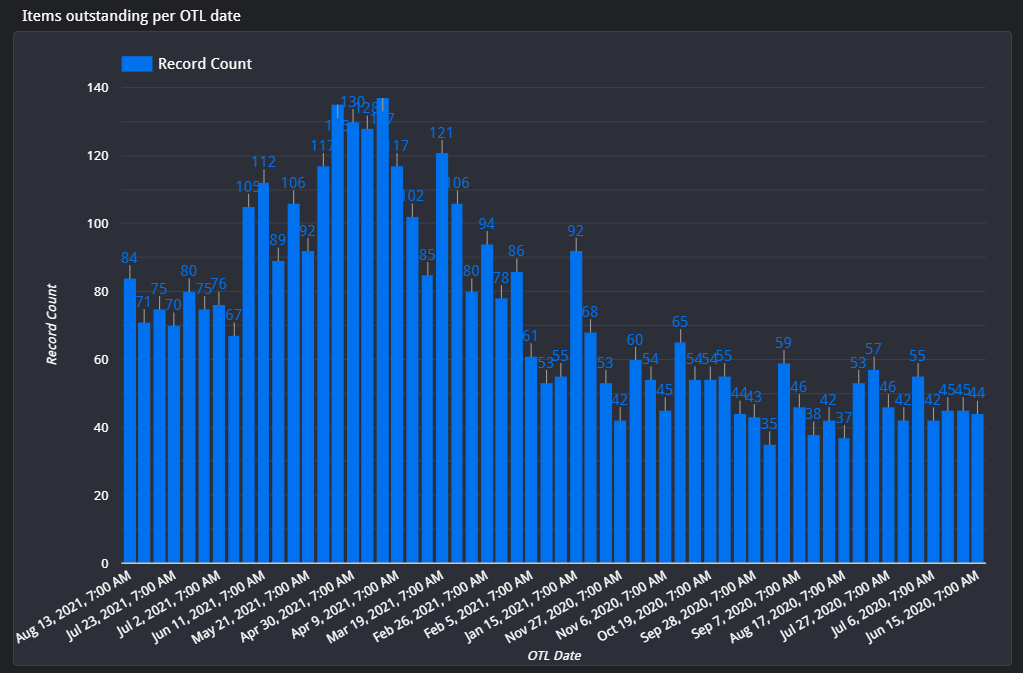
6. COVID OTL Dashboard – During the first COVID Lockdown most of the COVID PCR labs in South Africa were swamped with samples and couldn’t easily keep up with the testing volume. The Department of Health needed info of the back log of samples to be tested. Additionally, the Western Cape Area manager needed information of where the hold-up of samples were in the province. I was contacted as I had some (albeit limited) experience with databases and dashboards. The aim was to make a dashboard which could effectively track delayed samples, count them between centres and also determine where possible hold-ups were. With Dr. Heleen Vreede we set up automated data extractions on TrakCare (every 12 hours at 07h00 and 19h00) and made it such that the data extractions could be loaded onto a Google Sheets Database where Google Data Studio would get the data to calculate the respective counts and average outstanding times. This was done for the 3 COVID testing laboratories in the Western Cape at the time: Groote Schuur Hospital laboratory, Tygerberg laboratory and Green Point laboratory. There were various functions and calculations in this dashboard, with 4 large tables in a database. The dashboard also had various pages, each of which could be used for a specific query. Although not entirely focussed on Chemical Pathology, this project has learned me much about data science in general. As an example, two screenshots of the first page are shown below. The dashboard can be viewed at: WC OTL Dashboard – tinyurl.com/COVID-WC-OTL
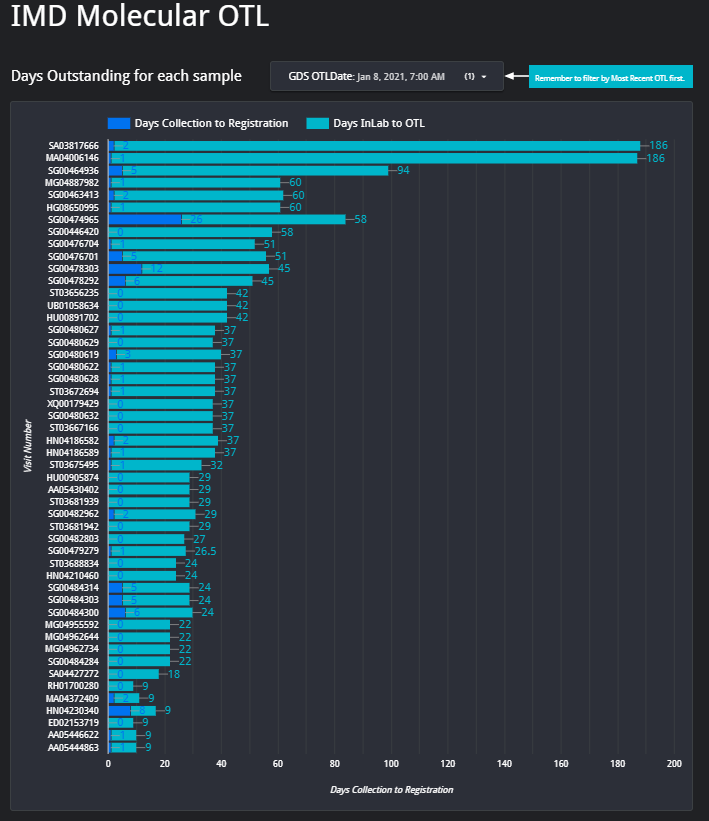
7. IMD OTL Dashboard – From above Dashboard, I was then approached by Surita Meldau, our IMD Genetics Laboratory Head to assist with the IMD Genetics’ lab OTL’s to try come up with a solution to easily track the most outdated samples for the planning of which samples to prioritize each week. We then implied the same principles of above COVID dashboard, into this IMD OTL Dashboard. The result was an interactive portal where we can view information such as patient name, surname, requesting hospital and type of genetic test, all on one platform. The reports are not generated 12-hourly as in the COVID dashboard, but weekly every Friday morning.
8. Transcribing results to TrakCare from CSV in an automated way – With the rapid ramp-up of COVID PCR and antibody testing, there were a few problems initially, which ranged from TrakCare database problems when the new test sets were created, billing problems and analyzer-to-LIS-interface problems. A few times I needed to assist with a few thousand results which needed to be removed and re-tranmitted or entered onto TrakCare. Soon I wrote a script which we could run on a computer, and later on a few computers at once to do the data entry onto TrakCare in an automated way from a CSV results file. This script has no SOP, but is hosted on Github is the need arrises again to use it. It is customized to the applicability at every instance.