GFR by Iohexol
Kindly download below document for the complete proposal as approved by the UCT Ethics Committee.
Kindly download below document for the complete proposal as approved by the UCT Ethics Committee.
| HOSP # | WARD | Nuclear Medicine | |
| CONSULTANT | DOB/AGE | 62 y Female |
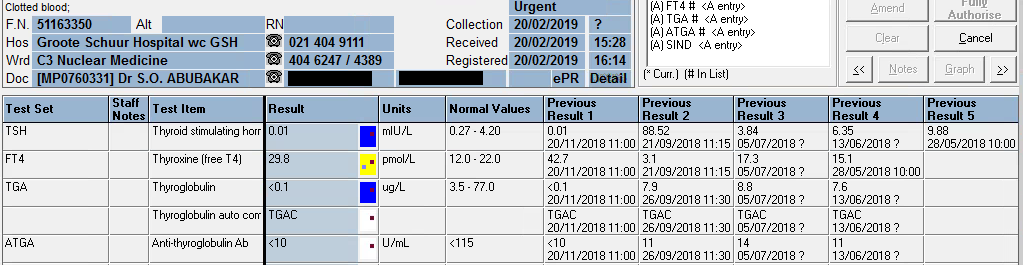
Thyroglobulin value of <0.1 ug/L upon signing results out.
Patient presented with a neck “swelling” in October 2016. Systemic complaints were not inquired, but none was reported.
TFT: euthyroid since presentation when the thyroid functions were first tested in 2016.
A solitary thyroid nodule was found in the neck, moving with swallowing.
TFT: euthyroid upon presentation, which is clear from the table below.
| 07/11/2019 | 08/08/2019 | 21/06/2019 | 20/02/2019 | 20/11/2018 | 26/09/2018 | 21/09/2018 | 05/07/2018 | 13/06/2018 | 29/05/2018 | 07/05/2018 | 08/01/2018 | 05/04/2017 | 26/10/2016 | |
| TSH | δ- 1,49 | δ- 7,07 H | δ+62,97 H | 0.01 L | δ- 0.01 L | δ+88,52 H | 3,84 | 6,35 H | δ+ 9,88 H | 2,86 | 4,05 | δ+ 3,26 | 1,62 | |
| Free T4 | 21,4 | δ+ 22,3 H | δ- 3.0 L | δ- 29,8 H | δ+ 42,7 H | δ- 3,1 L | 17,3 | CEGK | 15,1 | δ+ 14,9 | 12 | |||
| Free T3 | 4,8 | |||||||||||||
| Thyroglobulin (3.5-77.0 ug/L) | <0.1 L | <0.1 L | 0.1 L | <0.1 L | δ- <0.1 L | 7,9 | 8,8 | 7,6 | ||||||
| Anti-thyroglobulin Ab (<115 U/ml) | <10 | <10 | <10 | <10 | <10 | 11 | 14 | 11 |
From results above it can be seen that the patient was euthyroid upon presentation (in 2016 and later until excision – highlighted in bold)
Hemithyroidectomy was done in May 2018, and another hemithyroidectomy in September 2018, thus the thyroglobulin after the first and second surgery was still detectable, but absent after September 2018.
Ultrasound upon first presentation was indicative of a “suspicious nodule” in the thyroid gland.
PATHOLOGICAL DIAGNOSIS – excision biopsy of nodule (17/01/2018)
Specimen A:
Right lobe of thyroid, hemithryoidectomy:
Encapsulated follicular variant of papillary thyroid carcinoma
Specimen B:
Right cervical lymph node (Level VI), biopsy:
Negative for malignancy (0/1)
PATHOLOGICAL DIAGNOSIS – left thyroid lobectomy (11/05/2018):
Left lobe of thyroid, excision: Negative for malignancy
PATHOLOGICAL DIAGNOSIS:
Right thyroid, lobectomy: Negative for malignancy (05/09/2018):
The presence of thyroglobulin antibodies may interfere with the
thyroglobulin assay. The result of this test must be treated with reserve
if the patient has a positive thyroglobulin antibody test.TrakCare canned text for low thyroglobulin
| HOSP # | WARD | Murraysburg Hospital, Female Ward | |
| CONSULTANT | DOB/AGE | 51 y female |
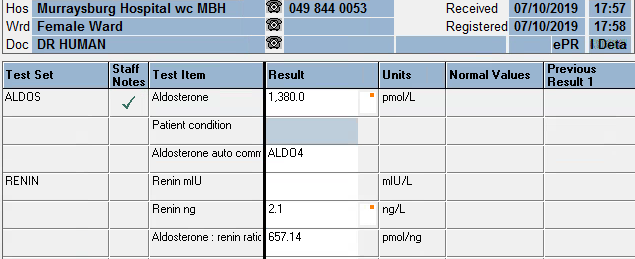
Aldosterone: 1380 pmol/L
Renin: 2.1 ng/L
Aldosterone: Renin ratio: 657.14 pmol/ng
Uncontrolled Hypertension, unresolved on maximum dose of 3 antihypertensives.


| Date | Sodium mmol/L | Potassium mmol/L | eGFR ml/min | GGT U/L | Chol mmol/L | TSH mIU/L | T4 pmol/L | FreeT3 pmol/L | Cort nmol/L |
| 21/04/2015 | 2,8 | >60 | 5,07 | ||||||
| 30/11/2015 | 3,8 | >60 | 4,53 | ||||||
| 15/11/2016 | >60 | 4,04 | |||||||
| 20/03/2017 | >60 | 4,36 | |||||||
| 05/06/2018 | 144 | 3,4 | 56 | 4,39 | 1,79 | 11,9 | 5 | 394 | |
| 20/08/2018 | 131 | 4,6 | 42 | ||||||
| 21/08/2018 | |||||||||
| 24/08/2018 | |||||||||
| 26/08/2018 | |||||||||
| 26/08/2018 | |||||||||
| 26/09/2019 | 139 | 2,4 | 45 | 0.81 | |||||
| 27/09/2019 | 142 | 2,6 | 43 | ||||||
| 01/10/2019 | |||||||||
| 02/10/2019 | 139 | 2,9 | 40 | CEGK | |||||
| 03/10/2019 | |||||||||
| 07/10/2019 | 138 | 3,9 | 38 | ||||||
| 31/10/2019 | 139 | 1,9 | 30 | 28 |
| Urine collection period | 24 h | Reference value |
| Urine volume | 3080 ml | |
| Ucreat | 2,2 mmol/L | |
| Umetadren | 160 nmol/L | |
| Unormetadren | 870 nmol/L | |
| dUmetadren | 493 nmol/24h | 152-913 |
| dUnormetadren | 2680 nmol/24h | 699-2643 |
| Umetadren:cr | 73 nmol/mmol creat | 17-91 |
| Unormetad:cr | 395 nmol/mmol creat | 75-309 |
Primary hyperaldosteronism causing secondary hypertension with accompanying renal injury.
Screening for primary hyperaldosteronism: most sensitive when >350 pmol/L
Beta-blockers suppress renin levels and should be stopped 2 weeks before testing.
Most sensitive when the ratio is >118 pmol/ng.
| HOSP # | WARD | False Bay Hospital Casualties | |
| CONSULTANT | DOB/AGE | 33y Female |
Urea 0.8 mmol/L; Creatinine 10 umol/L; Sodium 154 mmol/L; Potassium 5.4 mmol/L
Above results do not make sense for a 33 year old female, except if muscle weight is extremely low.

N/A
Inspection of the sample:

Lactate on analyser as done on serum sample: >22 mmol/L, dilution made: 1 in 10 revealed a lactate of 26.8 mmol/L in the sample. This could explain that Ringers Lactate was the contaminant in the sample, but can only be hypothesized with the available evidence.


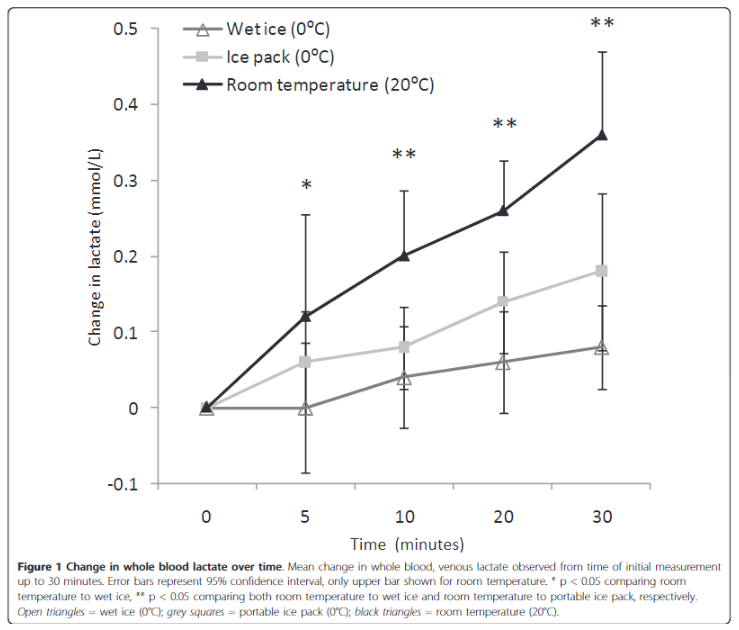
Lactate cannot be measured in SST (serum separator tubes) without taking into account the fact that the red cells will continue to metabolize the glucose in the sample to lactate via anaerobic metabolism through glycolysis.
Lactate concentration increases linearly over time, in whole blood. Factors affecting the rate of production are, among others:
NaF inhibits enolase, an enzyme acting late in the glycolytic pathway, and has no effect on enzymes that act early in the glycolytic pathway. … Glycolysis is instantly inhibited in erythrocytes, leukocytes and platelets when the blood pH is maintained between 5.3 and 5.9 with a citrate buffer.
Sage Journals: Ann Clin Biochem 2013;50: 3–5. DOI: 10.1258/acb.2012.012135


To perform serum albumin determinations on samples, explain the principle behind the Bromocresol Green method for albumin measurement and to list the factors that will cause interference with this method.
Albumin is known for its ability to bind many types of organic compounds, including organic dyes. When albumin selectively binds with Bromcresol Green (BCG) it causes a change in the absorbance maximum of BCG. The intense blue-green complex that is formed has an absorbance max of 670nm. Bromocresol reagent at pH 4.3 is negatively charged. The pI of albumin is 4.7.

For all spectrometric assays, always use a Reagent
blank. It usually contains all diluents and reagent in the reaction
solution, but no sample. Some reagent blanks do contain the sample as well, but
they lack one crucial reagent component needed to produce a colour-yielding
reaction. This is different from the water used to zero a spectrophotometer
(set 100% T).
| Sample | Water (µL) | Std (µL) | Control (µL) | Sample (µL) | BCG Reagent (µL) |
| Blank | 310 | – | – | – | 300 |
| Calibrators | 300 | 10 | – | – | 300 |
| Control | 300 | – | 10 | – | 300 |
| Serum Sample | 300 | – | – | 10 | 300 |

To set up a standard curve with more points along the usable range, I chose more points in the concentration range 20 – 40 g/L, which in my experience constitutes the bulk of albumin measurements.
3. Mix well read immediately at 630nm and record absorbances
| Layout of wells |
||||
| Dilution as per manual |
Dilution of 1:2 with H2O |
|||
| 1 | 2 | 3 | 4 | |
| A | Standard 0 | Unknown 1 | Standard 0 | Unknown 1 |
| B | Standard 1 | Unknown 2 | Standard 1 | Unknown 2 |
| C | Standard 2 | Unknown 3 | Standard 2 | Unknown 3 |
| D | Standard 3 | Unknown 4 | Standard 3 | Unknown 4 |
| E | Standard 4 | Unknown 5 | Standard 4 | Unknown 5 |
| F | Standard 5 | QC Low | Standard 5 | QC Low |
| G | Standard 6 | QC High | Standard 6 | QC High |
| H | Standard 7 | Standard 7 |

| Absorbance | Absorbance | |
| Standard concentration (g/L) | No dil | Dil 1:2 (150uL reagent mix + 150uL H2O |
| 0 | 0.095 | 0.065 |
| 20 | 0.506 | 0.245 |
| 25 | 0.719 | 0.345 |
| 30 | 0.779 | 0.395 |
| 35 | 0.784 | 0.411 |
| 40 | 0.999 | 0.504 |
| 50 | 1.242 | 0.593 |
| 80 | 1.477 | 0.68 |
4. Plot a standard curve and determine experimental concentrations of controls and serum samples


The figure below illustrates the formula used to determine the unknown concentrations.

Unknown concentrations were calculated as follows:
| Unknowns Sample no. |
Absorbance | Absorbance (Diluted 1:2) |
Calculated concentration | Calculated concentration (Diluted 1:2) |
Reference albumin values (from Roche Cobas 6000) | |
| 1 | 0.893 | 0.48 | Hemolysed | 38.8 | 44.2 | 29.1 |
| 2 | 1.057 | 0.55 | 48.1 | 53.0 | 44.2 | |
| 3 | 0.614 | 0.334 | 23.1 | 26.0 | 22 | |
| 4 | 0.997 | 0.5 | Hemolysed | 44.7 | 46.7 | 38.6 |
| 5 | 0.894 | 0.479 | 38.9 | 44.1 | 33.2 | |
| Lo | 0.843 | 0.453 | 36.0 | 40.9 | 31.9 | |
| Hi | 1.161 | 0.593 | 54.0 | 58.4 | 49.4 |

Yes. Hemoglobin does not absorb light at 670 nm, therefor will not interfere significantly with the analysis. See figure below:

It does however interfere in the following manner:
Hemoglobin decreases the apparent albumin concentration by 1 g/L for each 100 g/L added. Blanking does not correct this interference, and the negative bias is therefore caused by interference with the dye binding rather than hemoglobin color. For the BCP method, a blank correction is required on icteric sera and on grossly hemolyzed and grossly lipemic sera to correct for an underestimation of albumin caused by these agents. Heparin causes a positive interference with BCP and BCG methods. This interference can be eliminated by the addition of hexadimethrine bromide to a concentration of 50 mg/L in the BCP reagent
Kaplan’s Methods
Incubating the sample can give rise to other non-specific binding of analytes in the sample to the chromophore dye and a falsely elevated reading can be obtained.
Yes. The less time there is for other interfering substances to bind to BCG, potentially the more specific it will be to albumin, as albumin is the more specific binding to BCG.
Probably the most promising adaptation of the BCG reaction for albumin analysis utilizes fast reaction readings. Gustafsson reported that measuring the absorbance of the BCG-protein complex at 629 nm at a time shortly after mixing improves the specificity of the assay. Interference by other proteins such as ceruloplasmin and orosomucoid becomes significant at times greater than 5 minutes.
Kaplan’s Methods
Practical 3 :
PROTEIN ASSAY- BRADFORD
Total /100
INTRODUCTION
The Bradford protein assay, is a spectrophotometric assay that is more popular for protein concentration determination than other known protein assay such as the Lowry assay. The Bradford assay is simple, more sensitive and faster than other protein assays (Kruger, 2009). This assay is an example of a dye-binding assay and the dye used is Coomassie Brilliant Blue G-250 (Bradford, 1976; Becker, Caldwell and Zachgo, 1996; Kruger, 2009; Nouroozi and Noroozi, Moulood Valipour Ahmadizadeh, 2015). The principle of this assay relies on the physical interaction of the dye and protein in solution and results in an observable change in colour. The colour change is as follows; red (Amax 465 nm), when not bound to proteins and blue (Amax 595 nm) form of the dye carries a (-) charge and interacts with (+) charges on proteins to form a complex (Becker, Caldwell and Zachgo, 1996).
OBJECTIVES
2.1. To prepare standards through a series of dilutions
2.2. To measure the unknown concentration of a protein in solution via a spectrophotometer
2.3. To analyse, interpret results about CV%, SD, LOD and LOQ.
PROCEDURES
A. PREPARATION BEFORE THE PRACTICAL
Complete the following BEFORE your practical session:
• You would need to do some extra reading on the Bradford protein assay and spectrophotometer principles (i.e. Beer Lambert law) in preparation for your practical and test.
• Find and print SDS’s for the following chemicals; Tris (trisaminomethane), Hidrochloric acid (HCL), ethanol, Phosphoric acid and Coomassie Brilliant Blue G-250.
• Prepare a practical plan for your experiment that you will be conducting today.
B. PRACTICAL SESSION (Total 50)
Complete the following DURING your practical session:
(1) Complete the practical test.
(2) Using the Bradford Assay determine as follows:
Materials provided:
• Tris buffer: 10 mM Tris-HCl (pH 7.0)]
• Bovine serum albumin (BSA) stock solution: [2 mg/ml BSA in Tris buffer (pH 7)]
• Bradford reagent; [0.01% (w/v) Coomassie Brilliant Blue G-250, 4.7% (w/v) ethanol, 8.5% (w/v) phosphoric acid]
• Unknown protein sample
Method:
a) In Eppendorf tubes, prepare a series of BSA solutions of varying concentration by diluting the
2 mg/ml BSA stock solution with Tris-HCL buffer (You will need ~200μL of each dilution) to set up a calibration curve (at least 7 concentrations to be used).
Serial dilutions were made in 1.5mL Eppendorf tubes:
| Standard no. | Protein concentration (ug/ml) |
| 1 (500uL of provided 2ug/ml stock solution) | 2 |
| 2 (250 uL of S1 plus 250uL Tris-HCl diluent) | 1 |
| 3 (250 uL of S2 plus 250uL Tris-HCl diluent) | 0.5 |
| 4 (250 uL of S3 plus 250uL Tris-HCl diluent) | 0.25 |
| 5 (250 uL of S4 plus 250uL Tris-HCl diluent) | 0.125 |
| 6 (250 uL of S5 plus 250uL Tris-HCl diluent) | 0.0625 |
| 7 (250 uL of S6 plus 250uL Tris-HCl diluent) | 0.03125 |
| 8 (Also Blank – Only 250uL Tris-HCl) | 0 |
b) Add 2.5 mL of Bradford reagent to a separate cuvette for each of your samples and label them appropriately. Consider the value of determining the concentration of one or more dilutions of your unknown sample as well as the undiluted (“neat”) unknown sample.
To save cuvettes, I have used an old refurbished microtitre plate with 10x less volume, hence 250uL
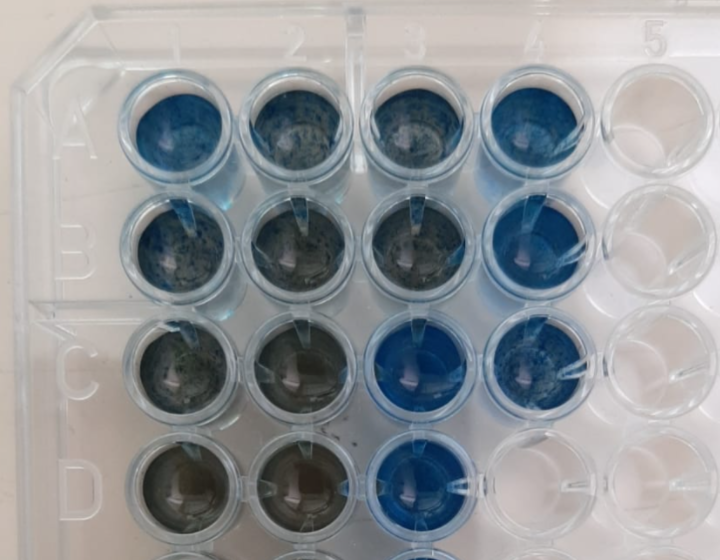
c) Prepare your samples by adding 50μL of each protein sample (diluted standard or unknown) separately to the Bradford reagent in the appropriately labelled tube. Mix the tubes by gentle inversion several times, and let the colour develop for 5 min. Observe and record the colour change of your standard samples as a function of protein concentration. A blank sample is prepared by mixing 50μL Tris buffer with 2.5 ml Bradford reagent.
As above, to save reagent and test my pipetting skills, I have used 5uL as one set of additions and also made a 1:1 (2x) dilution of my standards to run another calibration curve. The unknown sample was also added as neat and a 2x dilution.
d) You will need to determine which portion of the UV/vis spectrum, specifically which wavelength will be useful for following the dye bound by protein. Take a full spectral scan of your Bradford reagent blank. When your standard samples have fully developed, take a full spectral scan of the most concentrated standard you prepared.

e) Based on your results, choose a single wavelength suitable to analyse the results of your dye-binding assay. Measure and record the absorbance of each standard and unknown sample at your chosen wavelengths using cuvettes.
From above wavelength scan it is evidenced that the maximum absorbance after colour development occurs at 595 as published widely in the literature for the Bradford assay. I am, however going to perform a slight variation also published before, by using the ratio of absorbance 595nm/465nm as the signal, as it has before been shown to be more sensitive. The rationale thereof is that there is reduction of absorbance intensity at 465nm and increase of intensity at 595nm, hence likely causing slight increases in sensitivity and arguably a more accurate assay.
f) At your determined wavelength, read your unknown sample at approximately every 10 minutes for 1 hour, you will use these readings to calculate the percentage (%) change over time.

g) Prepare your highest standard in five (5) cuvettes and read the absorbances of each cuvette two times, so in total you will have 10 readings. These results you will use to calculate the protein concentrations and then calculate the CV% and SD
h) Make sure your lab space is clean and disinfected.
C. AFTER PRACTICAL SESSION
Complete the following for submission before or during the next practical
Answer the following questions:
QUESTION 1 (Total 15)
Using the resulting equation for the calibration curve, determine the protein concentration of your unknown sample.
| Prot. Conc | Abs 595 | 465nm | 595/465 ratio |
| 2 | 1,4949 | 0,488 | 3,06332 |
| 1 | 1,146 | 0,6248 | 1,834187 |
| 0,5 | 0,9158 | 0,7388 | 1,239578 |
| 0,25 | 0,7401 | 0,8203 | 0,902231 |
| 0,125 | 0,6648 | 0,8788 | 0,756486 |
| 0,0625 | 0,6138 | 0,9023 | 0,680262 |
| 0,03125 | 0,5932 | 0,9143 | 0,648802 |
| 0 | 0,5633 | 0,9234 | 0,610028 |
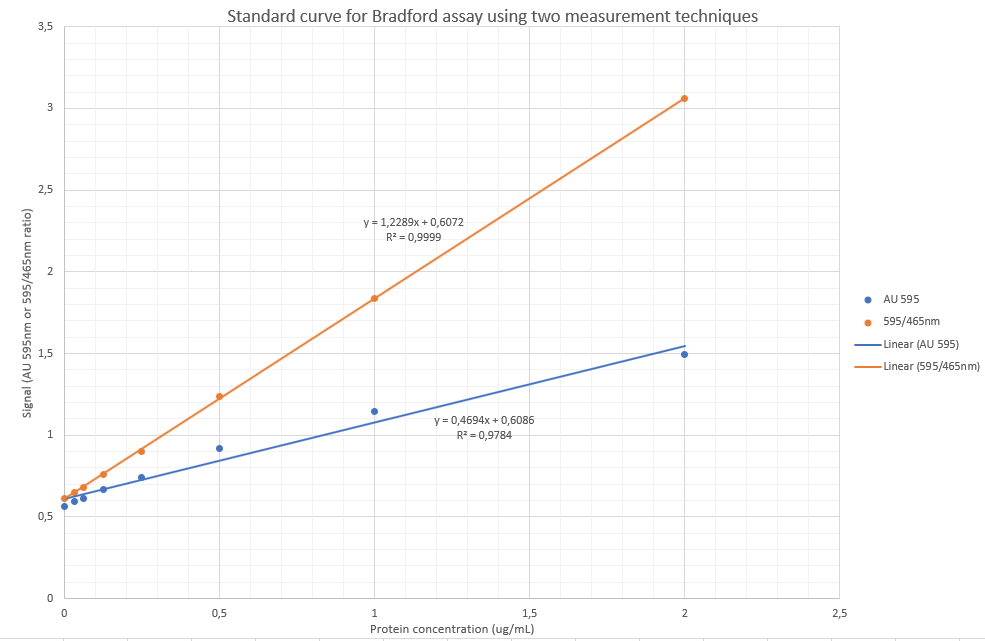
To determine the unknown:
Via AU595nm:
y=0.4694x + 0.6086
x= (y-0.6086)/0.4694
x= 1.34g/L
Via the 595/465nm ratio:
y = 1.2289x + 0.6072
x=(y-0.6072)/1.2289
x= 1.25g/L
QUESTION 2 (Total 10)
Calculate the percentage (%) change over time of your unknown sample and comment on the stability of your assay.
Referring to Fig. 2 – To calculate the %change over time is relatively simple by using the slope of the linear regression line: If using the orange line’s formula at 595nm only: slope = – 0.0081, which means that the absorbance values decreases in general by 0.0081 AU per minute. This is, however subject to variability as the reagent/protein complexes was observed as precipitating out and the final portion of the curve (after 50 min) is likely not fitting due to this phenomenon. Nevertheless, using a decrease of 0.0081AU per minute, means that at an absorbance value of 1.25 (top of the calibration curve),
0.0081/1.25*100 =
0.65% decrease in absorbance per minute.
The stability of the assay is likely around 15-20 minutes.
QUESTION 3 (Total 15)
Calculate the CV% and SD using your data.
| Absorbance Value | Calculation |
| 1.6096 | |
| 1.6124 | |
| 1.5923 | |
| 1.5345 | |
| 1.498 | |
| 1.5602 | |
| 1.5624 | |
| 1.5425 | |
| 1.4823 | |
| 1.4567 | |
| Stdv | 0.050538 |
| Mean ( (Sum of values)/n) | 1.54509 |
| CV% | 3.270859 % |
QUESTION 4 (Total 10)
Calculate the LOD, LOQ, and comment on the linearity of your assay.
Using only the 595nm absorbance yielded a poor result (r=0.9784).
Using the 595/465 ratio, the linearity was much better (r = 0.9999)
SE of intercept: Excel Function: STEYX(X-values;Y-values)
LOD = 3.3 * (SD of intercept / slope)
LOQ = 10 * (SD of intercept / slope)
| Prot. Conc | Abs 595 | 465nm | 595/465 ratio |
| 2 | 1,4949 | 0,488 | 3,06332 |
| 1 | 1,146 | 0,6248 | 1,834187 |
| 0,5 | 0,9158 | 0,7388 | 1,239578 |
| 0,25 | 0,7401 | 0,8203 | 0,902231 |
| 0,125 | 0,6648 | 0,8788 | 0,756486 |
| 0,0625 | 0,6138 | 0,9023 | 0,680262 |
| 0,03125 | 0,5932 | 0,9143 | 0,648802 |
| 0 | 0,5633 | 0,9234 | 0,610028 |
| AU595 only | |||
| Slope | 0,469384 | ||
| STEYX | 0,052252 | ||
| LOD | 0,367358 | ug/mL | |
| LOQ | 1,113206 | ug/mL | |
| 595/465 ratio | |||
| Slope | 1,228876 | ||
| STEYX | 0,051192 | ||
| LOD | 0,137467 | ug/mL | |
| LOQ | 0,416565 | ug/mL |
REFERENCES:
Becker, J. M., Caldwell, G. A. and Zachgo, E. A. (1996) ‘Protein Assays’, in Biotechnology. Elsevier, pp. 119–124. doi: 10.1016/b978-012084562-0/50069-2.
Bradford, M. M. (1976) A Rapid and Sensitive Method for the Quantitation of Microgram Quantities of Protein Utilizing the Principle of Protein-Dye Binding, ANALYTICAL BIOCHEMISTRY.
Kruger, N. J. (2009) ‘The Bradford Method For Protein Quantitation’, in The Protein Protocols Handbook. Humana Press, Totowa, NJ, pp. 17–24. doi: 10.1007/978-1-59745-198-7_4.
Nouroozi, R. V. and Noroozi, Moulood Valipour Ahmadizadeh, M. (2015) ‘Determination of Protein Concentration Using Bradford Microplate Protein Quantification Assay’, International Electronic Journal of Medicine, 4(1), pp. 11–17. doi: 10.31661/iejm158.
Raw data:
| HOSP # | WARD | Red Cross Children’s Hospital ICU | |
| CONSULTANT | Dr. S Prof. G |
DOB/AGE | 14 day old Neonate |
Sodium = 198 mmol/L (H) (136-145)
1 day of poor feeding. Child passing very hard/ dark brown stool for the preceding 10 days.
Birth weight @ term: 3.380kg. Delivered vaginally after induction of labour because of spontaneous rupture of membranes at 40 weeks gestation. Discharged home without any problems after 1 day.
On arrival at district hospital: Temp: 38oC, Sats 96% on Nasal O2, Finger prick glucose: 10mmol/L, Capillary refill time: 6 seconds,
HR: 140bpm.
Blood gas:
pH: 7.26,
BE -16.3,
pCO2 3.2 kPa,
Na 190.
Weight: 2.2kg (birth weight: 3.380 kg, thus 35% weight loss)

Urine organic acid analysis by GCMS demonstrates elevation of the liver markers 4-OH-phenyllactate and 4-OH-phenylpyruvate together with lactaturia. Succinylacetone, a marker for tyrosinaemia type 1 is absent. Moderate ketonuria with elevated dicarboxylic acids C6, C8, and C10 is also present, these changes suggest a lipolytic response to catabolic or fasting stress or hypoglycaemia together with underlying hepatic dysfunction with lactataemia but are non-specific for an IMD per se.
Patient was pure water depleted with a sodium concentration of 198 mmol/L. The mother was not lactating adequately despite the infant sucking well, evidenced by the fact that when expressed breast milk was tried, there was too little milk for the baby to drink. The nurses’ notes confirmed this finding. This finding also confirms the failure to produce stool volume and the normal urine organic acid profile with evidence of starvation / fasting stress.
When considering a patient with high plasma sodium concentration it is
important to bear in mind:
Ref: Walmsley – Cases in Chemical Pathology 4th
ed.
It is also important:
| HOSP # | WARD | ENT Clinic | |
| CONSULTANT | DOB/AGE | 35 Y Male |
Prolactin 10 986.0 ug/L (4-15.2)
Dilutions:
1/10 >4700;
1/100 = 10821;
1/50 = 10 986.
Epistaxis
Patient with epistaxis referred to the ENT specialist clinic. No relevant medication history.
35 y male with a large left post-nasal space mass, a vascular mass involving the pituitary fossa.
?NBL (non-benign lesion)
?Sinonasal malignancy
?Pituitary Tumour
TSH 0.91 pmol/L (0.27-4.20)
Free T4 15.7 pmol/L (12-22)
FSH 0.8 IU/L ↓ (1.5-12.4)
LH 0.2 IU/L ↓ (1.7-8.6)
Testosterone 0.2 nmol/L ↓ (8.6-29.0)
PTH 1.7 pmol/L (1.6-6.9)
Prolactin measuring method:
The Elecsys prolactin sandwich immunoassay uses two monoclonal
antibodies directed against human prolactin.
R1 = biotinylated antibody – recognizes the N-terminal end of the
prolactin molecule
R2 – ruthenium complexed antibody probably reacts with a region in the
middle of the prolactin molecule.
1st incubation: a biotinylated monoclonal prolactin-specific
antibody and a monoclonal prolactin-specific antibody labeled with a ruthenium
complex form a sandwich complex.
2nd incubation: after addition of streptavidin-coated
microparticles, the complex becomes bound to the solid phase via interaction of
biotin and streptavidin.
Reaction mixture aspirated into the measuring cell where microparticles
are magnetically captured into the surface of the electrode. Unbound substances are then removed with
ProCell.
Application of a voltage to the electrode then induces
chemiluminescent emission which is measured by a photomultiplier, results
calculated by a standard curve.
Monomeric prolactin – 7744 ug/L (70% recovery after PEG precipitation)
Biopsy: confirmed tumour stained strongly positive
with prolactin suggesting a prolactinoma.
Pituitary Macroprolactinoma
Sandwich immunoassays are prone to high dose hook-effect. There are
various ways to overcome this effect. (This will later be expanded on – see AFP
/ Beta-HCG).
Prolactin appears in the serum as:
Precipitation by PEG yields the active monomeric
prolactin, expressed as a percentage recovery after precipitation. Big-big prolactin consists of an
antigen-antibody complex of monomeric prolactin-immunoglobulin G and is defined
as macroprolactin. This has a long
half-life in blood when compared to normal prolactin and gives false high
readings of prolactin, leading to unnecessary investigations in certain
cases. A high prolactin should thus be
confirmed by doing a PEG precipitation.
| HOSP # | WARD | Surgical ICU | |
| CONSULTANT | Dr. Heleen Vreede | DOB/AGE | 23y Female |

Fluid triglycerides were requested on three samples, without any clinical information.
The laboratory history was explored, to find that the patient had three subsequent samplings daily from a pleural fluid cavity.
A month prior to presentation, the patient had a breached stillbirth.
The following was found on Histology:
EPISODE NUMBER:
SA03381462
CLINICAL DETAILS:
23 year old female. G02 P2-1. VDRL: negative. Smoking: 8/day. Alcohol: none. HIV: negative. 750g breech stillbirth at 28/40.
MACROSCOPY:
The plate measures 130 x 100 x 30mm and weighs 196.8g.
The membranes are complete without evidence of meconium staining.
The cord measures 300mm in length with an average diameter of 15mm. Three umbilical vessels are identified with 3 twists per 100mm. The cord insertion is off-centre, 20mm from the plate margin.
Congested blood vessels are identified on examination of the foetal surface.
Cut-sections of the plate show:
- Retroplacental clot.
MICROSCOPY:
General:
Placental weight for gestational age is below the 10th percentile at 196.8g. Partial autolysis is present throughout the specimen.
The umbilical cord and membranes:
The umbilical cord contains two arteries and one vein. There is no evidence of vasculitis or funisitis. Wharton's jelly and membranes do not show meconium uptake. The amniocytes are intact and show no evidence of vacuolation or hyperplasia.
Chorionic plate:
The chorionic plate vessels are focally dilated. There is no evidence of chorioamnionitis.
Villi and intervillous spaces:
The stem villous vessels show partial obliteration as well as stromal sclerosis. Distal villous hypoplasia as well as accelerated villous maturation is seen. Intervillous thrombi are seen as well as intraparenchymal extension of the retroplacental haematoma. There is no evidence of infarction, villitis or intervillositis.
Maternal surface:
There is evidence of a large retroplacental haematoma. No chronic deciduitis or untransformed blood vessels are seen.
PATHOLOGICAL DIAGNOSIS:
Placenta, examination:
Maternal vascular malperfusion.
Retroplacental haematoma.
Reported by: Dr M Du Toit
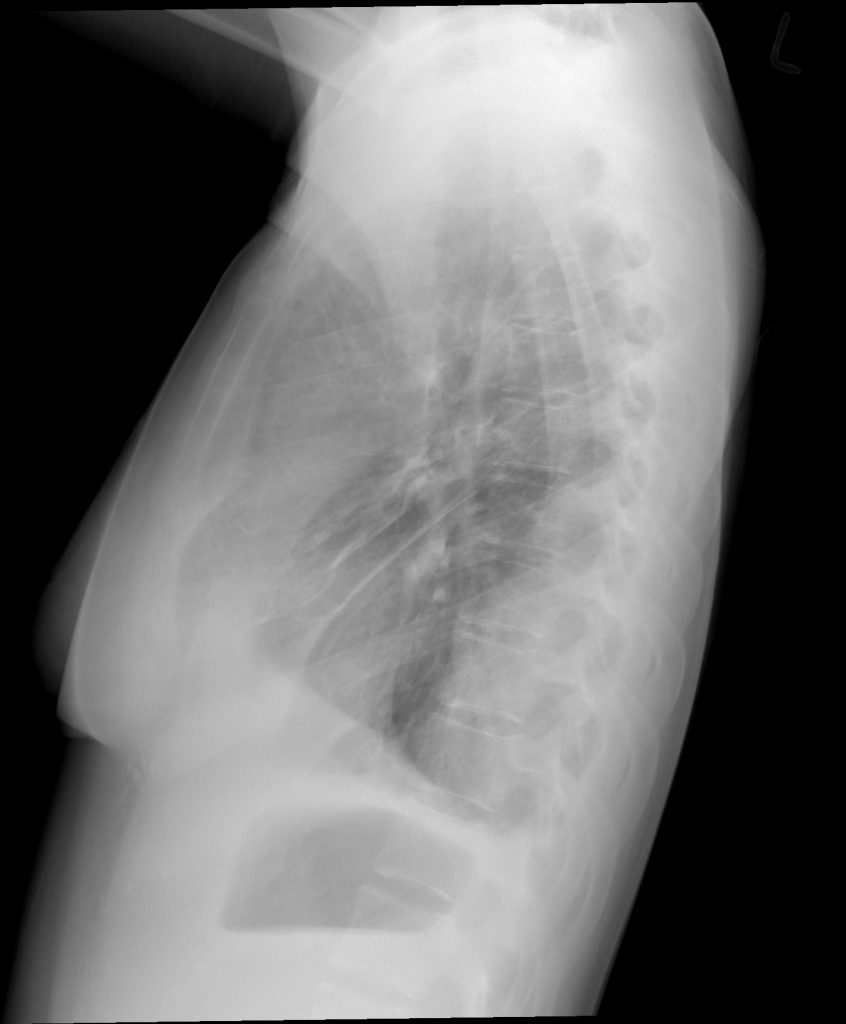
Clinicians were indeed querying a chylothorax. A thoracic duct injury was suspected.
Unfortunately little clinical information is known, as can be seen above. The following table shows the clinical info which has been captured on the respective episodes’ request forms:
      Clinical history for episodes
< SA03215505 >      ?UTI IN PREGNANCY
< SA03381462 > 03/10/2019     PLACENTA
< SA03466495 > 07/11/2019     MEDIASTINITIS
< SA03466500 > 08/11/2019     MEDIASTINITIS
< SA03466533 > 08/11/2019     MEDIASTINITIS
< SA03467168 > 08/11/2019     MEDIASTINITIS
< XC00366131 >      ILLEG
< SA03467081 >      ILLEGIBLE
< SA03469305 >      NECK ABSCESS
< SA03469995 >      ILLEGIBLE
< SA03472064 >      MEDIASITINITIS
< SA03470738 >      NECK ABSCESS
< SA03476491 >      PUS FLUID + MEDIASTINITIS
< SA03476496 >      PUS / FLUID + MEDIASTINITIS
< SA03476502 >      PUS / FLUID + MEDIASTINITIS
< SA03476507 >      PUS / FLUID + MEDIASTINITIS
< SA03489396 >      ?CHYLOTHORAX
< SA03485823 >      SEPSIS
< SA03491179 >      NECK ABSCESS
< SA03493180 >      Neck abscess with sepsis.
< SA03494446 >      CVC TIP
< SA03509355 >      LOOSE STOOLS
< SA03513657 >      THORACIC SURGERY
< SA03531013 >      MEDIASTINITIS
A pleural fluid triglyceride >1.24 is suggestive of chylothorax.
The additional finding of a thin white layer present on the top of the sample after centrifugation indicates the presence of chylomicrons in the sample, which further supports the diagnosis of chylothorax.


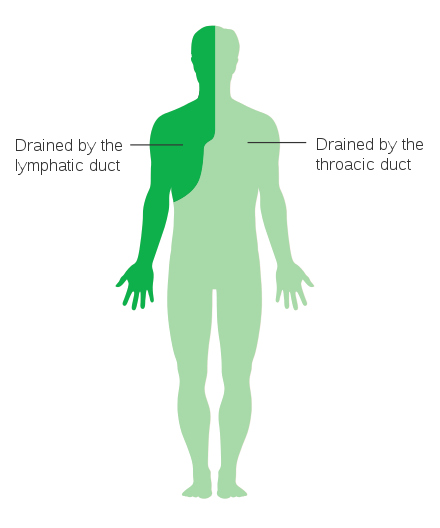
The primary role of the thoracic duct is to carry 60 – 70% of ingested fat at a concentration of 0.4 – 6 g/dl from the intestine to the circulatory system.


Classically, a chyloma, a collection of chyle below the pleura develops when the thoracic duct first leaks. Although rarely detected, it manifests itself as a swelling in the supraclavicular fossa which may be associated with severe chest pain, dyspnoea and tachycardia.
Chylomas can also manifest themselves at other sites of the pleura without causing supraclavicular swelling. Eventually the chyloma bursts through the pleura where the chyle accumulates in the pleural space.
Very rarely, the chyle leak may lead to chylomediastinum or chylopericardium.

Roughly 2.4 l of chyle is transported through the lymphatic system every day.
Damage to, or rupture of the thoracic duct can give rise to a large and rapid accumulation of fluid in the pleural space.
Causes of chylothorax can be classified as follows:
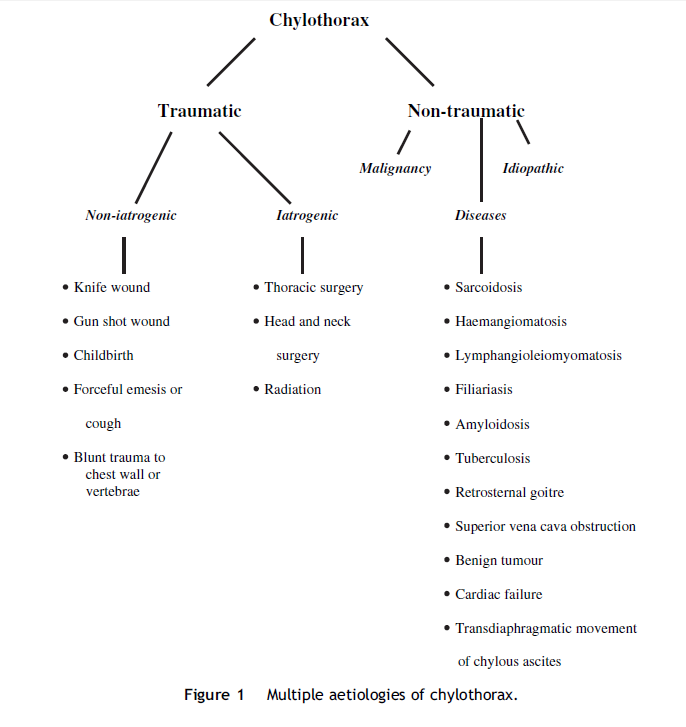
The theorized causes of chylothorax in this case could be one of the following:
Remember Chylomicrons float!

| HOSP # | WARD | G16 Medical Ward | |
| CONSULTANT | DOB/AGE | 54 y Female |
21/08/2018 Two ACTH tests (referred to another laboratory) and two
Cortisol levels (at our laboratory) were done.
At first it was thought to be a dexamethasone suppression test, but then
realized the clinicians were suspecting hypopituitarism.
10h05: ACTH 0.7 pmol/L ↓ (1.6-13.9) Cortisol 8 nmol/L ↓ (Morning: 133- 537; Afternoon 68 – 327)
10h35: ACTH 1.8 pmol/L N (1.6-13.9)
Cortisol 68 nmol/L ↓ (Morning: 133- 537; Afternoon 68 – 327)
? hypopituitarism
Known with a pituitary macroadenoma, previously seen at the Radiotherapy clinic in 2016.
No clinical info available.
For Primary adrenal insufficiency one would expect: Hyperpigmentation
(due to ↑ ACTH), +/- hyperkalemia/hyponatremia (aldosterone effect), +/-
virilization.
For Secondary adrenal insufficiency there is subtle symptoms, electrolytes are not deranged significantly because aldosterone function is preserved. See table on Bishop 7th ed. p. 459.
Measurement of
plasma ACTH concentration is used to assess Cushing’s disease, adrenal tumors,
ectopic ACTH-producing tumors, Addison’s disease, Nelson’s syndrome, and
hypopituitarism.
The
laboratory diagnosis of hypopituitarism, however is relatively straightforward.
In contrast to the primary failure of an endocrine gland that is accompanied by
dramatic increases in circulating levels of the corresponding pituitary tropic
hormone, secondary failure (hypopituitarism) is associated with low or normal
levels of tropic hormone. This is the
diagnosis in this case with the history of previous radiotherapy which was
given for a macro-adenoma.
Free T4 on 19/04/2018 was 7.8 pmol/L (12-22), also suggesting possible hypopituitarism, although a TSH would be helpful.
Hypopituitarism confirmed.
Dexamethasone suppression test need only measurement of cortisol, not accompanying ACTH, except in extended work-up however, where a Cosyntropin (CRH) stimulation test can be done to distinguish between pituitary or hypothalamic insufficiency.
Evaluation of pituitary function need the Primary hormone (Cortisol) as well as the tropic hormones from the pituitary (ACTH).
| HOSP # | WARD | C15 Casualties | |
| Consultant | DOB/AGE | 33 year Female |
Paracetamol 25ug/ml (163 umol/L) Serum osmolarity 310mmol/L
Brought to casualties with stupor from Mitchells Plein Hospital.
33 y female presented with stupor after ingestion of an unknown amount of pills. Empty container of Amitriptiline and Paracetamol was found with her.
Non-specific neurologic signs, but delirium present. Patient did have an episode of vomiting. No pathological signs on abdominal examination.
12/08/2018: Na 156 mmol/L (H) Urea 4.2mmol/L Tot. Bili 4 umol/L K 1.9 mmol/L (L) Creat 88 umol/L ALT 82 U/L Cl 97.9 mmol/L (L) Gluc 3.52 mmol/L AST 238 U/L Ammonia 35 umol/L Bicarb 16.6 mmol/L (L) Osmol 310 mmol/L (H) Osmolar gap: -10 mM Anion Gap: 47 mmol/L
Marked elevation of hepatocellular enzymes, ductal enzymes within normal range. Within the course of three days the patient developed Klebsiella Pneumoniae on intubation in ICU with DIC and marked renal failure (Creat 506, Urea 26.8) and demised in ICU 3 days after admission, although liver enzymes were not markedly more deranged as initial presentation.
Paracetamol: The Paracetamol level was never repeated after admission. Doing an in-house experiment with calibrator and spiking the calibrator samples with N-acetylcysteine correlating with therapeutic plasma levels, I demonstrated that our method on the Roche analyzer, with the enzymatic assay, causes a clinically significant negative interference in the measured paracetamol.
The enzymatic assay principle:
arylacylamidase hydrolysis o-cresal + periodate catalyst
Acetaminophen→ p-aminophenol+acetate → indophenol (measured @600nm)
Tricyclic antidepressant levels 58 ug/L ([TCA] in overdose patients range from 29-1732ug/L, but has not been found to correlate to clinical outcome, unless plasma level is more than 1000ug/L).
Klebsiella Sepsis (confirmed on blood culture 1 day after death) DIC with marked renal failure.