A case of renal tubular potassium loss
| HOSP # | WARD | Internal Medicine Ward | |
| CONSULTANT | Heleen Vreede | DOB/AGE | 86 year old lady |
Abnormal Result
Hypokalemia in a 86 year old lady.
Presenting Complaint
Muscle weakness for the preceding 3 weeks.
History
Known with hypertension, dyslipidaemia and chronic kidney disease.
Presented at a private practice with symptomatic hypokalemia. Patient gave a history of 3 weeks body weakness and dizziness and said she hasn’t been eating well for the prior three weeks.
No other symptoms. No previous medical admissions or procedures.
The patient has just had persistent hypokalemia in hospital despite supplementation. The consultant in Internal Medicine attributed her persistent CMP disturbances to refeeding type syndrome.
In the hospital admission the patient was receiving:
- Simvastatin 20mg dly PO
- Calcium carbonate (1g elemental Calcium) q8h PO
- SlowMag 2 tabs daily PO
- Metoclopramide 10mg q8h PO
Examination
Not available
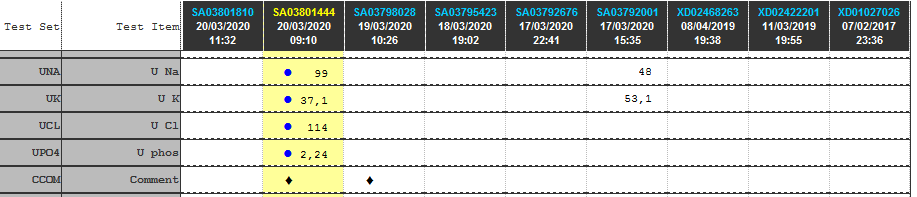
Laboratory Investigations
Other Investigations
Transtubular Potassium Gradient (TTKG)
TTKG (Transtubular potassium gradient)………… 8.16
TTKG values between 8 and 9 are considered normal in patients with a normal diet.
TTKG >/= 3 in hypokalemia suggests renal potassium wasting.
Ref: Ethier JH et al. Am J Kidney Dis. 1990 Apr;15(4):309-15. The transtubular potassium concentration in patients with hypokalemia and hyperkalemia.
Values used for calculation:
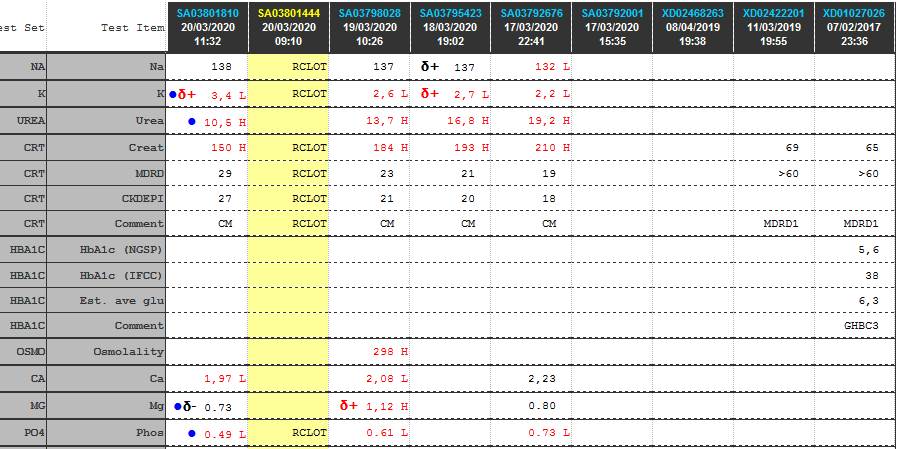
Urine K…………… 37.1 mmol/L
Serum K……………. 3.4 mmol/L
Urinary Osmol ……… 396 milliosmoles
Plasma Osmol ………. 296 milliosmoles
Fractional Excretion of Potassium (FEK)
FEK ……………………………………. 45 %
Tubular reabsorbtion of potassium (1-FEK)….. 55 %
Values used for calculation:
Urine K…………….. 37.1 mmol/L
Serum K……………… 3.4 mmol/L
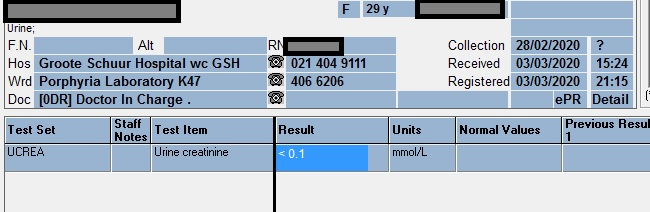
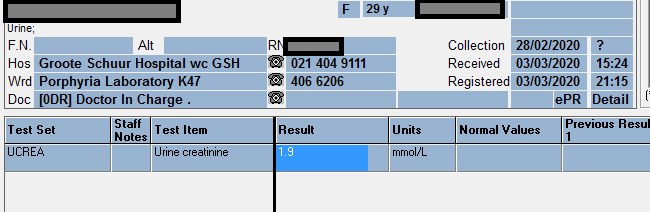
Urine Creatinine …….. 3.6 mmol/l
Serum Creatinine …….. 150 umol/l
Final Diagnosis
Take Home Message
A study by Elisaf, M & Siamopoulos, KC (Postgrad Med J 1995; 71: 211-212), clearly showed that in patients with hypokalaemia of extrarenal origin FEK is less than 6.5%, i.e. a FEK more than 6.5% is indicative of inappropriate potassium loss. FEK was more than 9% in all patients with hypokalaemia of renal origin.
The study concluded that in hypokalaemic patients with normal renal function, FEK is a useful tool in the diagnostic approach of hypokalaemia.
Limitations: A random urine sample was used to determine these values. Ideally a 24 hour urine collection should be used and theoretically should provide a more accurate estimation of tubular function. The fractional excretion of potassium is however inherently normalized to creatinine.
No clinical info / medication history was supplied. The most likely cause of inappropriate potassium loss in the urine is medication (iatrogenic) like diuretics and some antihypertensives. Ideally, if a pathogenic, rather than iatrogenic cause of potassium loss is suspected, the patient needs to be free of potassium supplementation and all medication which could influence tubular function must be stopped before analysis of the renal tubular electrolyte handling.