Section 2 – Candidate Details
General details
| SA ID: 9110245133085 HPCSA number: MP 0801186 Trainee #: C17-01-04 |
dieter.vdwesthuizen@nhls.ac.za / dietervdwes@gmail.com Tel (w): 021 404 4135 Tel (m): 082 861 2093 |
| Work Address: C20 NHLS Laboratory, Groote Schuur Hospital, Main Road, Observatory, Cape Town, 7925 |
Residential Address: 2 Brunswick Road, Tamboerskloof, Cape Town, 8001 |
Qualifications
Degrees
| Dec 2014 | M.B.Ch.B. | University of the Free State, South Africa |
Diplomas
| Jan 2015 | Basic Life Support | University of the Free State, South Africa |
Short Courses
| Sept 2017 | Marketing Course (10 weeks) | University of Cape Town (via Getsmarter) |
| April 2019 | STATA basic data analysis(3 days) | Centre for Statistical Analysis and Research: CESAR |
Hospital Appointments
| Jan 2018 – Current | Registrar in Chemical Pathology | NHLS, Groote Schuur Hospital & Red Cross Children’s Hospital |
| Jan 2017 – Dec 2017 | Community Service | Policlinic OPD (Area Military Health Unit) & 3 Military Hospital, Bloemfontein, South Africa |
| Jan 2015 – Dec 2016 | Medical Internship | Pelonomi, Universitas & National Hospitals, Free State Hospital Complex, Bloemfontein, South Africa |
Section 2.1 – Portfolio of Learning
A possible case of growth hormone deficiency
| HOSP # | WARD | G4 Adolescent Ward | |
| CONSULTANT | Ariane Spitaels / Heleen Vreede | DOB/AGE | 12 y Male |
Abnormal Result
Low growth hormone with an abnormal clonidine stimulation test.
Presenting Complaint
At 7 years of age, patient presented with chronic headaches.
History
CT-brain revealed acute hydrocephalus. Endoscopic 3rd ventriculostomy was done. MRI revealed a lesion posterior to mid-brain and pons as well as a hyper-intensity on T1 with contrast. A glioma was queried as the cause.
Patient recently was identified to have decreased growth velocity (4cm / year) in the preceding 6 months and was also admitted for a clonidine stimulation test. Patient was primed for 2 days.
Examination
N/A
Laboratory Investigations
Histology
GROSS DESCRIPTION: Specimen labelled Sub-occipital tumour consists of 5 fragments of tissue measuring 4-5mm each.
HISTOLOGY: Sections of the brain biopsies show sheets of bipolar neoplastic cells with piloid cytoplasmic processes. Scattered pleomorphic tumour cells, microcystic areas and areas resembling oligodendrocytes are present. Rosenthal fibres and eosinophilic granular bodies are not a prominent feature. There is no vascular proliferation or tumour necrosis.
Comment: See frozen section below.
PARAFFIN SECTIONS: Sections of the brain tumour show piloid areas (cells with hair-like processes, gemistocytic cells and focal Rosenthal fibres. Mild nuclear atypia is noted. There are no mitotic figures, vascular proliferation or areas of necrosis. Scattered entrapped neurons are noted.
IMMUNNOHISTOCHEMISTRY: Neurofilament: Highlight background neural processes
GFAP: Diffusely positive p53: Weak staining in less than 10% of the tumour cells, interpreted as negative.
Ki67 proliferation index: < 4%
CONCLUSION: Brain, biopsy: Juvenile pilocytic astrocytoma.
Other Investigations
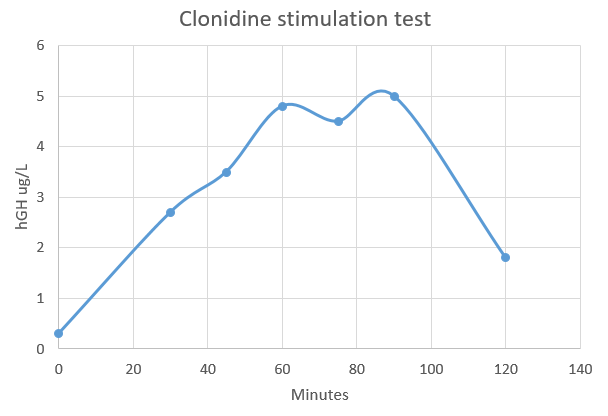
Clonidine stimulation testing
| Time after Clonidine injection (minutes) | Result |
| 0 | 0.3 |
| 30 | 2.7 |
| 45 | 3.5 |
| 60 | 4.8 |
| 75 | 4.5 |
| 90 | 5 |
| 120 | 1.8 |
Final Diagnosis
Since the hGH concentration did not rise to above 10 ug/L, the diagnosis is likely that of growth hormone deficiency, or hyposomatotropism.
Take Home Message
Provocative Testing for Growth Hormone deficiency (GHD)
The following provocative (dynamic) tests are available for hGH deficiency:
- Insulin tolerance test
- Clonidine stimulation test
- Levodopa-propranolol HCl test
- Arginine HCl test
- Glucagon test
Provocative GH testing is criticized for several reasons, including the following:
- None of the tests reproduces the physiologic secretory pattern of GH because they involve the use of pharmacologic stimuli to indirectly assess physiologic GH production.
- Individual clinicians assign what are essentially arbitrary definitions for subnormal responses (ie. cutoffs for peak serum GH values)
- The reproducibility of provocative tests and GH RIAs is limited. Many pediatric endocrinologists apply other clinical criteria (eg, growth velocity Z score below -2) and do not perform provocative GH tests to diagnose GHD.
Despite limitations, provocative GH tests remain helpful ways to measure GH reserve. Pediatric endocrinologists use physiologic stimuli (eg, strenuous exercise, fasting, deep sleep) and pharmacologic stimuli (eg, clonidine, levodopa-propranolol, glucagon, arginine, insulin) to provoke GH secretion. The tests must be performed after overnight fasting, firstly ensuring that the children are euthytoid.
To improve diagnostic sensitivity and specificity, at least 2 provocative tests are performed. Immediately before and during the earliest phases of puberty, GH production is often indistinguishable in unaffected children and in children with GHD. Serum GH concentrations typically rise during puberty. Many investigators suggest that children approaching puberty should be given gonadal steroids to prime the growth hormone-releasing hormone (GHRH)-GH axis before testing.
Most clinicians use a peak serum GH concentration of more than 10 ng/mL (30 IU) to exclude GHD in children. Specific provocative tests are described below.
Insulin tolerance test
Insulin-induced hypoglycemia is the most potent stimulus for GH secretion and the most dangerous tool for provocative GH testing in patients who may have GH deficiency. Insulin tolerance testing takes advantage of the hormonal counterregulatory response to hypoglycemia. In patients without GHD, plasma concentrations of glucagon, epinephrine, norepinephrine, cortisol, corticotropin, and GH are elevated in response to acute hypoglycemia.
To perform the test, patients fast for 8 hours. Then, lispro insulin 0.1 U/kg of body weight is administered rapidly as an intravenous bolus. Serial blood samples are subsequently obtained to measure GH, cortisol, and glucose concentrations at 0, 15, 30, 60, 75, 90, and 120 minutes. With each sample, the blood glucose level is simultaneously determined by using a bedside glucometer to document an appropriate reduction and to ensure safety. Performance of the test is considered adequate when the blood glucose level decreases below 50% of its baseline value.
Adverse effects expected during the procedure include symptoms secondary to hypoglycemia, such as lethargy, shaking, confusion, headache, abdominal pain, nausea, vomiting, syncope, and seizure activity. The test must be performed under the watchful eye of the physician who can begin prompt resuscitation with glucose and/or glucagon as soon as the diagnostic samples have been obtained. To date, the insulin tolerance test is the only provocative test associated with fatalities; therefore, personnel must be trained and conduct the test judiciously.
Clonidine stimulation test
Clonidine acts centrally to stimulate alpha-adrenergic receptors, which are involved in regulating GH release. Serum GH levels are obtained at baseline and at 60 minutes and 90 minutes after the oral administration of clonidine 0.1 mg/kg. Clonidine may induce hypotension during the test. Therefore, warn parents that they may experience lethargy and/or depression for 24 hours after clonidine is administered.
Levodopa-propranolol HCl test
Levodopa is a dopamine receptor agonist. Dopamine is involved in the stimulation of GH secretion. In the converse, beta-adrenergic control negatively regulates GH release.
Propranolol is a beta-blocker used to hinder inhibitory input affecting GH release, while levodopa simultaneously stimulates GH release by means of the dopaminergic pathway. Propranolol 0.75-1 mg/kg is orally administered before levodopa. The dosage of levodopa for levodopa-propranolol HCl testing varies with weight, so that children weighing less than 15 kg receive 125 mg, children weighing 10-30 kg receive 250 mg, and children weighing more than 30 kg receive 500 mg.
Blood samples for GH testing are drawn at 0, 60, and 90 minutes after the administration of levodopa. Adverse effects include nausea and, in rare cases, emesis. In addition, the patient’s heart rate may decrease because of the use of propranolol. Closely monitor his or her vital signs, and ensure that appropriate resuscitative measures are available.
Arginine HCl test
Arginine appears to exert a direct depolarizing action on somatropic neurons, increasing GH secretion. After an overnight fast, patients are given 10% arginine HCl in 0.9% NaCl 0.5 g/kg (not to exceed 30 g) as a constant intravenous infusion over 30 minutes. Blood samples for GH testing are obtained at 0, 15, 30, 45, and 60 minutes after the infusion of arginine is begun. Arginine has historically been used as a primer before insulin is administered during insulin tolerance testing.
Glucagon test
Glucagon increases peripheral glucose concentrations by means of glycogenolysis and gluconeogenesis. Because glucagon is rapidly metabolized, an abrupt reduction in serum glucose concentration ensues and triggers the release of counterregulatory hormones.
After fasting overnight, patients receive an intramuscular injection of glucagon 0.03 mg/kg (not to exceed 1 mg). Some clinicians advocate the concomitant use of propranolol to inhibit the catecholaminergic response to hypoglycemia. Serum GH concentrations are determined at 0, 30, 60, 90, 120, 150, and 180 minutes after glucagon administration. Nausea and, occasionally, emesis may occur.
Growth hormone reference intervals provided should be seen as a guideline only. Specifically, reference intervals or random growth hormone levels are not useful for diagnosing growth hormone deficiency.
For this, stimulation tests are required. A recent paper established clinical evidence-based cut-off limits for
diagnosing growth hormone deficiency in children and adolescents following growth hormone stimulation tests, by various commercially available immunoassays, compared to isotope dilution mass spectrometry (ID-MS).
Reference: Clinical evidence-based cutoff limits for GH stimulation tests in children with a backup of results with reference to mass spectrometry, Wagner et al, European Journal of Endocrinology (2014)171, 389-397TrakCare Autocomment
| Assay | Cut-off limit |
| Immulite 2000 (Siemens) | 7.77 ug/L |
| AutoDELFIA (Perkin-Elmer) | 7.44 ug/L |
| iSYS (Immunodiagnostic System) | 7.09 ug/L |
| Liaison (DiaSorin) | 6.25 ug/L <– Current assay |
| DXI (Beckman-Coulter) | 5.15 ug/L |
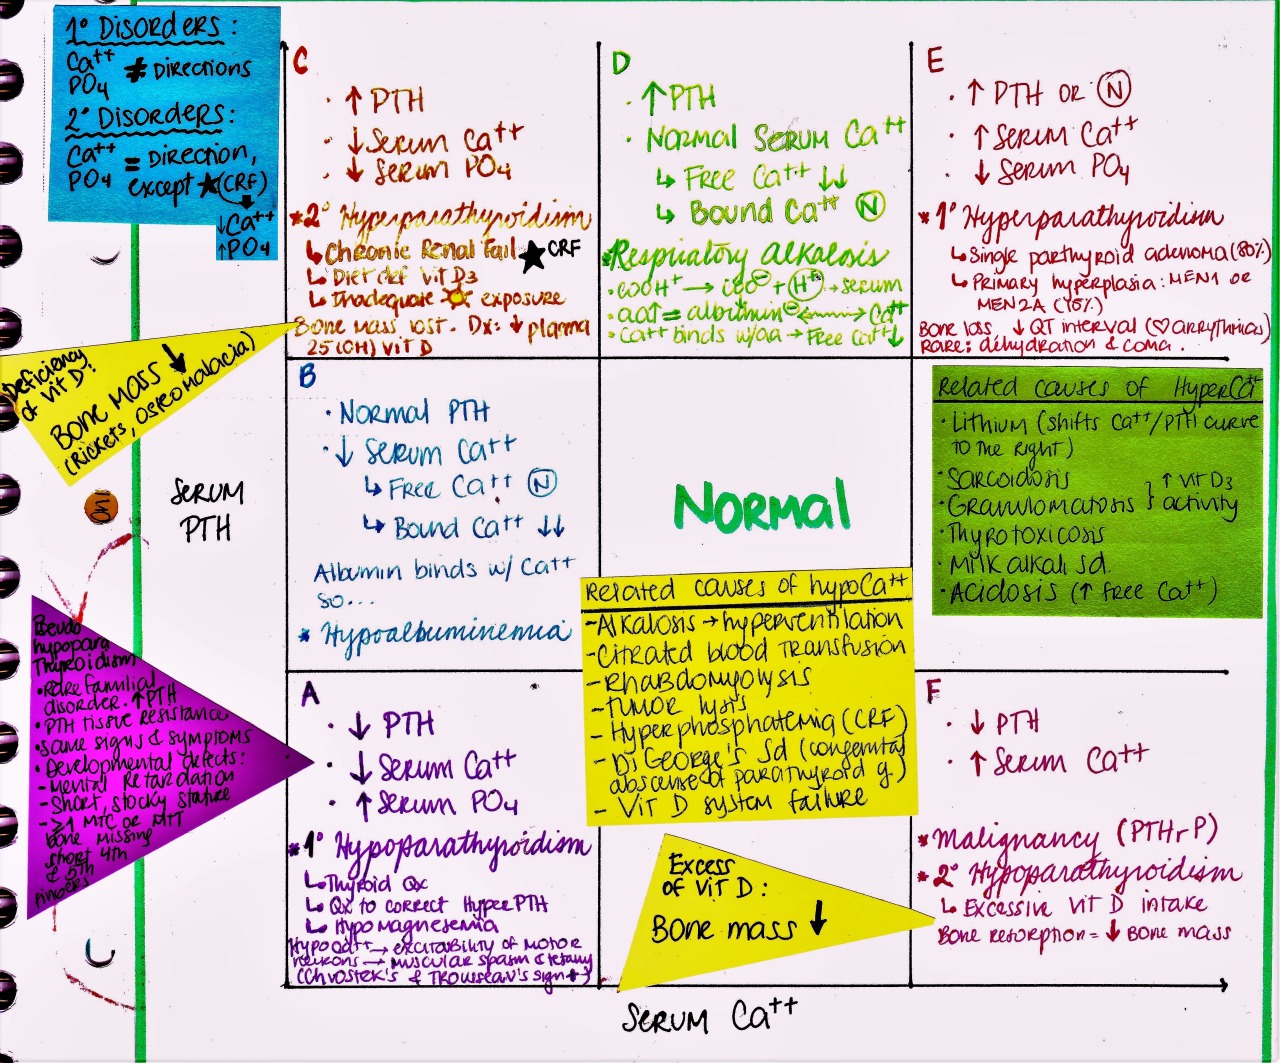
A case of Primary hyperparathyroidism and subsequent parathyroidectomy
| HOSP # | WARD | Medical Ward | |
| CONSULTANT | Dr. Jody Rusch | DOB/AGE | 59 Y Male |
Abnormal Result
Hypercalcemia with hypophosphatemia
Presenting Complaint
History
This is a patient with parathyroid adenoma (and resulting longstanding hypercalcemia and hypophosphatemia, which is typical). Adenoma was removed yesterday, acc. to what I can see on a frozen section. Phosphate is dropping even more 0.42 mM (0.78 – 1.42) (on bloods taken this afternoon) and it will likely become significantly lower even.
Examination
Laboratory Investigations

PTH was initially significantly raised, although the renal function was normal. This means that there is likely hypercalcemia due to primary hyperparathyroidism.

Other Investigations
Final Diagnosis
Take Home Message
Phosphate supplementation may be quite important as there was longstanding autonomous PTH secretion, depleting stores of phosphate via phosphaturia (also PTH induced). There will likely not be much PTH secretion for some while, hence Vit. D activation will seize and little phosphate absorbed from the GIT due to longstanding lack of phosphate transporters. FGF-23 secretion will also seize and with the lack of PTH, the bone will not resorb and the remodeling process will consume the phosphate in the blood. Most mechanisms to increase phosphate physiologically will likely be dysfunctional at this time. Because he will not adequately absorb phosphate from the GIT (because of failure to activate Vit. D, he may need supplementation of phosphate IV).
Kidneys will however be a bit less phosphaturic (due to lack of PTH), thus he may respond quite well to IV phosphate.
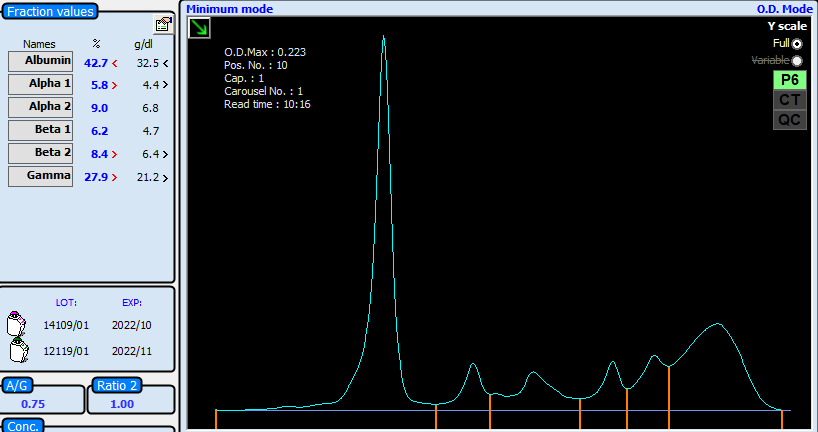
A case of abnormal CSF chemistry results

| HOSP # | WARD | Neurology Ward | |
| CONSULTANT | Jody Rusch | DOB/AGE | 17 y Female |
Abnormal Result
Increased CSF IgG / albumin Index
Decreased CSF Glucose
Presenting Complaint
At this admission, she presented to Groote Schuur Hospital with a history of parasthesias and lower limb weakness. Her symptoms have had a rapid progression to completed paraplegia, with loss of sphincter control over three days. She does not report altered sensorium or alteration in her sleep wake cycle.
History
The patient had two prior episodes of TB and Systemic Lupus Erythematosis, which was diagnosed in 2017. Her presenting symptoms was malar rash, arthralgia, and having positive serological markers.
She has subsequently been diagnosed with class-II nephritis and autoimmune haemolytic anaemia. She was on maintenance immunosuppression regimen of prednisone and azathioprine between 2017-19.
She has had two prior episodes of TB in 2014 and 2018.
She was diagnosed with optic neuritis in October 2019, after she developed visual loss in her left eye with no perception of light. Retrospectively she reports a prior episode of unilateral visual loss in her right eye in February 2019, consistent with an episode of ON. On the basis of her ON she had her immunosuppression escalated to monthly pulses of cyclophosphamide, from November 2019 until march 2020.
She has now developed an acute severe inflammatory longitudinally extensive myelitis, as result of seropositive Neuromyelitis Optica Spectrum Disorder (NMOSD).
Neuromyelitis Optica Spectrum Disorder, or NMOSD, is a rare, lifelong and debilitating autoimmune disease of the central nervous system (CNS), characterized by inflammation in the optic nerve and spinal cord.
Examination
Higher function examination was normal. Cranial nerve examination revealed bilaterally dilated pupils with sluggish responses. Relative afferent pupillary defect (RAPD) was noted in the left eye. Visual acquity is reduced in both eyes, with the left being more severely affected than the right. Fundoscopy showed bilateral disc pallor, no active papillitis. She had no further cranial nerve or bulbar signs. Upper limb motor examination showed paratonia in the right upper limb. The left had mild loss of dexterity and power in her left hand. Reflexes were symmetrical. Power in her lower limbs was reduced with 0/5 power, she would have intermittent involuntary movements to tactile stimuli. She was hypertonic with a triple response. She has a T4 sensory level to light touch and pin prick and has marked joint position sensation loss in both her legs.
The patient was admitted for evaluation of her Myelitis. She was started on high dose methylprednisolone and after 3 days of no response she was started on Plasma exchange. Her spastic paraplegia remains unchanged. She has received pressure care, physiotherapy, OT and bowel regimen in the ward. Given her young age, and aggressive disease (developing an severe acute inflammatory myelopathy while on monthly cyclophosphamide pulse therapy), Department of Internal Medicine hopes she can undergo induction therapy with rituximab (375mg/m2) for her seropositive NMOSD in the hopes of avoiding progressive disability and recovering some voluntary function of her limbs.
Laboratory Investigations
CSF Glucose
CSF glucose was 1.4 mmol/L. This is low. It is unfortunately not known what the plasma glucose was at that time, as it wasn’t sent with a plasma glucose sample at the same time, as one would have hoped. If one assumes the plasma glucose have been normal (3.5-5.5mmol/L) and that CSF glucose’s normal range is 0.6-0.8 x plasma glucose, then this value (0.4 – 0.25 that of serum) is significantly low.
Low CSF glucose is indicative of:
- bacterial meningitis,
- mycobacterial infection (TB meningitis),
- mycoplasmal infection and
- fungal infection in the CSF.
- Leucocytes may also decrease CSF glucose – thus it may indicate a disease process rather than only bacterial infection.
CSF Protein
CSF protein of 2.47 g/L (0.15 – 0.45 g/L) is significantly raised. This is indicative of increased permeability of the blood-CSF barrier, most commonly due to inflammatory conditions, but can also be elevated due to:
- Decreased spinal CSF flow above the sampling level due to:
- abscess
- tumor (see also Froin Syndrome)
- collapsed intervertebral disc
- These allow for increased equilibration of fluid between CSF and plasma.
- Immune response within the CSF (intrathecal synthesis of IgG)
- Destruction of brain tissue releasing proteins directly into CSF.
- Neonates (term and pre-term) have a higher reference range – up to 1.7 g/L.
CSF Albumin
CSF albumin of 1271 mg/L (100 – 300) is elevated. This value is increased significantly, likely indicating an increase in the permeability of the blood-brain-barrier (severe impairment).
CSF Albumin Index
The CSF Albumin Index was 31.8 mg/g (<9).
CSF albumin is best interpreted in conjunction with the serum albumin. CSF albumin is corrected for leaking of albumin from the serum (thus incorporating the serum albumin concentration). This is called the CSF albumin index (mg/g) = CSF albumin(mg/L) / serum albumin (g/L)
- <9: intact blood-CSF barrier
- 9-14: slight impairment
- 14-30: moderate impairment
- >30: severe impairment
CSF IgG / Albumin Index
CSF IgG index = 0.86
IgG should under normal situations be almost totally excluded from CSF (blood:CSF ratio of >/= 500:1). Intrathecal production of IgG follows infiltration of the space by B-lymphocytes in demyelinating disorders.
Increase in CSF IgG can however be due to increased permeability form the plasma (dysfunctional barrier), increased plasma IgG concentration or intrathecal production. To correct for the former two, plasma IgG and serum albumin is used in an equation to get the above named index, which tries to isolate CSF IgG for the portion which was produced intrathecally.
The formula is: IgG index= (CSF IgG / Serum IgG) x (Serum Albumin / CSF Albumin). Units of measurement should be similar, at least for serum and CSF respectively.
Reference interval for CSF IgG index is 0.3 – 0.7. Ratios greater than 0.7 indicate increased intrathecal synthesis, as seen in more than 80% of cases of Multiple Sclerosis (MS) and other demyelinating disorders. False elevations occur in traumatic tap and SAH. CSF IgG index is more reliable when the CSF Albumin Index is normal (i.e. when the barrier function is not decreased, but obviously this is rarely the case, as inflammation leads to decreased barrier function).
CSF IgG synthesis rate
153 mg/day
The rate of intrathecal IgG synthesis can be estimated by the empirically derived Tourtellotte’s formula and a synthesis
rate of greater than 8 mg/day is found in most cases of multiple sclerosis. It is a more complex formula, with several constants and probably provides no additional information than the IgG index. (Ref: Tietz 6th Ed.)
Other Investigations
Investigations to this point include the following:
1. MRI brain and spine shows Longitudinal extensive transverse myelitis from the cervical to the lumbar level.
2. FBC and CEU was normal – Neutrophils were normal, lymphocyte count was 0.81.
3. Serologies were ANA, AdsDNA, AntiSm, Anti-Ro Positive. C3 and C4 were normal.
4. HIV, HBV, HCV serology was normal.
5. Serum AQP4 serology positive with a titre of 10
6. CSF: Protein-2.47, Gluc-1.4,P8, L37 R0, IgG index0.87, CLAT, GXP, Culture negative.
7. CD19: 250
8. CXR showed bilateral reticular nodular infiltrate and features of post of TB bronchiectasis
Final Diagnosis
Neuromyelitis Optica Spectrum Disorder
Take Home Message
CSF Glucose
Using a ratio of CSF to serum
glucose ratio of less than 0.4, an 80% sensitivity and 98%
specificity was found for distinguishing bacterial (n = 119)
versus aseptic cases (n = 97) of meningitis.
Donald P, Malan H, van der Walt A. Simultaneous
determination of cerebrospinal fluid glucose and blood
glucose concentrations in the diagnosis of bacterial
meningitis. J Pediatr 1983;103:3. – Referenced from Tietz Textbook of Clinical Chemistry 6th ed.
Recovery from meningitis results in recovery of glucose before CSF cell counts and Total Protein.
CSF glucose is typically normal in CSF viral infections, exceptions may include: Meningoencephalitis with Mumps, EV, HSV, HZV.
Leucocytes may also decrease CSF glucose – thus it may indicate a disease process rather than only bacterial infection.
Ratio of CSF:serum glucose has limited utility in neonates and in pts. with hyperglycemia.
CSF glucose <1.0 mmol/L is highly indicative of bacterial meningitis.
If intellectual disability, seizures and motor impairment is present along with low ratio, think of GLUT-1 transporter deficiency – then measure CSF lactate.
CSF Chemistry
As described above
Correcting total protein for Traumatic tap
The presence of CSF bleeding results in approximately 0.010 g of protein / L per 10^6 RBCs / L
The Vitamin D conundrum
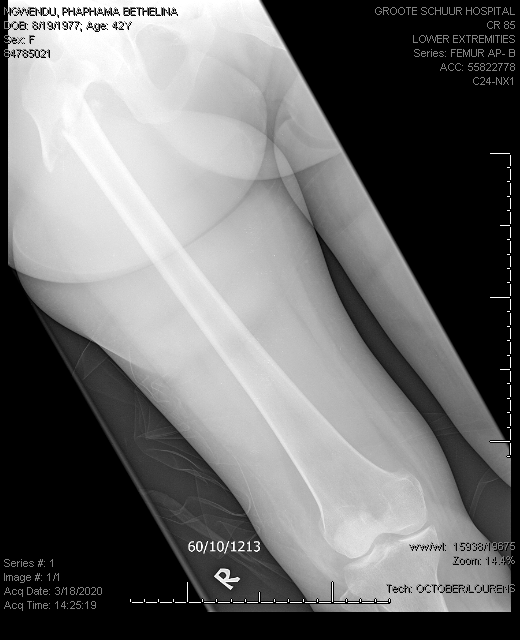
| HOSP # | WARD | F22 Orthopaedics Ward | |
| CONSULTANT | Dr. Jody Rusch | DOB/AGE | 42 Y Female |
Abnormal Result
Total Vitamin D of 27.1 nmol/L on 18 March 2020.
Total Vitamin D of 65.4 nmol/L on 01 April 2020.
Presenting Complaint
Patient had a low impact femur fracture on 18 March 2020 :

History
Patient is known with:
- previous deep venous thrombosis in 2018, on Warfarin therapy
- ?Epilepsy, patient is on carbamazepine, for which the Endocrinology specialists were of opinion that it may have been the cause of the low Vitamin D level.
Examination
Laboratory Investigations
Other Investigations
Final Diagnosis
Vitamin D deficiency likely due to carbamazepine therapy.
Take Home Message
I was not aware that patients on carbamazepine (or other enzyme inducing agents) have lower Vitamin D levels, and it became evident after a quick literature search that it was in fact the case, see the abstract of the article below, also see another article written by a colleague of mine, Jusine Cole, on the Vitamin D controversies.
Also, I have learned that although “total Vitamin D”, as the assay is named in our immunoassay package insert and on TrakCare LIS, has to do with the total portion with regards to protein binding (to Vitamin D binding protein) and not so much to the fact that calcitriol and calcidiol is measured.
It is however evident that, since the cross-reaction in the immuno-assay is quite pronounced with the various forms of Vitamin D, that total indeed, might be an accurate description. In reality, the assay is however called the Total 25-hydroxy Vitamin D.
Vitamin D levels and bone turnover in epilepsy patients taking carbamazepine or oxcarbazepine.
Abstract
PURPOSE:
Evidence suggests that enzyme-inducing antiepileptic drugs (AEDs) may decrease serum 25-hydroxyvitamin D (25-OHD) levels and increase bone turnover. We sought to determine whether these are affected by treatment with carbamazepine (CBZ) or oxcarbazepine (OXC).
METHODS:
We measured serum levels of 25-OHD, parathyroid hormone (PTH), osteocalcin (OCLN), bone alkaline phosphatase (BAP), and urinary N-telopeptides of type I collagen cross-links (NTX) in normal controls (n=24) and in epilepsy patients taking CBZ (n=21) or OXC (n=24) in monotherapy. CBZ patients were subsequently switched overnight to OXC monotherapy, and after 6 weeks, the tests were repeated.
RESULTS:
25-OHD levels were lower in each drug-treated group (OXC, 19.4+/-2.3 pg/ml; CBZ, 20.4+/-2.4) than in the controls (27.5+/-2.8) (ANOVA, p=0.052). This difference was significant for the OXC group (p<0.05). PTH, BAP, and NTX did not differ significantly among groups. OCLN levels were somewhat elevated in the OXC group (2.79+/-0.47 ng/ml) and more clearly and significantly elevated in the CBZ group (3.63+/-0.36) compared with controls (2.38+/- 0.41) (p=0.053). Because the data were very similar between OXC and CBZ groups, they were combined to increase statistical power. The combined drug-treatment group had significantly higher BAP (p=0.02) and lower 25-OHD (p=0.015) than did controls. The latter remained significant even after accounting for the confounding effects of age on 25-OHD levels (p<0.05). No significant differences were found after CBZ patients were switched to OXC.
CONCLUSIONS:
Epilepsy patients taking OXC or CBZ have significantly lower 25-OHD than do normal controls, with a pattern of changes in other bone biomarkers suggestive of secondary hyperparathyroidism. It may be prudent for patients taking CBZ or OXC to be prescribed 25-OHD replacement.
The Vitamin D cutoff conundrum

Introduction
Vitamin D status is considered important for calcium balance and bone health as 1,25 (OH)2 vitamin D (calcitriol) promotes calcium absorption from the gut and has pleiotropic effects in bone. Vitamin D deficiency leads to hypocalcaemia and osteomalacia or rickets in adults and children respectively.
Vitamin D status was also brought under the spotlight owing to an apparent association with cardiovascular health and several other chronic disorders. These associations were noted in animal studies but the findings were not mirrored in humans. Vitamin D sufficiency or insufficiency is determined using quantitative analytical techniques, with results interpreted against statistically-determined cutoffs.
The Controversies
Controversies exist due to the analytical methods as well as the methods to determine these decision limits. The analytical methods available to quantify vitamin D include immunoassays and HPLC or LC-MS/MS methods. The majority of labs use immunoassays to measure 25(OH) vitamin D (calcidiol), and a smaller group also measure calcitriol by immunoassay. Calcidiol occurs at higher concentrations in the serum and, in most cases, it better reflects the vitamin status than calcitriol, as 1-alpha-hydroxylase activity is modulated according to calcitriol and calcium status.
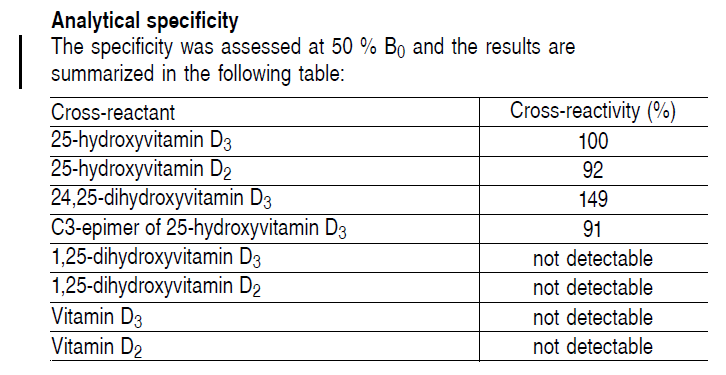
However, immunoassays are non-specific regarding metabolites of vitamin D and therefore results of calcidiol and calcitriol measurement may not be accurate due to cross-reactivity. LC-MS/MS is a much more accurate methodology to measure both calcidiol and calcitriol as well as other metabolites of interest, such as 24,25(OH)2 vitamin D. One controversial point is, therefore, whether or not calcidiol and calcitriol measurements by immunoassay are accurate.
The second controversy lies in the determination of the decision limits for vitamin D repletion, sufficiency and insufficiency. Currently, there are two major sets of decision limits to choose from. The first were determined and recommended by the Endocrine Society based on recommended daily allowances (RDA) for the vitamin. It is argued that the concept of the RDA is misinterpreted and the methods for setting the RDA not understood. These decision limits are high, and by these limits some 50% of most populations are diagnosed with vitamin D insufficiency. This is also dangerous, as replacement of vitamin D may lead to hypervitaminosis D, which is not benign and may in fact increase the risk of falls and fractures. Another consequence is the demand for testing vitamin D levels is very high, which is expensive for healthcare funders or individuals, with questionable health benefits.
The other popular set of decision limits were determined based on the risk of falls and fractures (Institute of Medicine) – a more functional approach. The result of using these limits is that the majority of the population will fall into the vitamin D sufficient or replete groups, and only individuals at high risk will have their status checked and/or monitored and receive supplementation as necessary. This is a more cost- and clinically-effective approach, but is yet to be globally adopted.

The final point to be made is perhaps what drives the interest in vitamin D status, and it may be suggested that it is the reagents and pharmaceutical industry as they stand to gain from increased testing and demand for supplements.
Identification of sample type
| HOSP # | WARD | Red Cross Children’s Hospital, Neurosurgery ward |
|
| CONSULTANT | George van der Watt | DOB/AGE | 11y Male |
Abnormal Result
CSF Glucose: <0.1 mmol/L
CSF Protein: <0.01 mmol/L
Both of the above results have already been rerun on the same analyzer with the same result.
Presenting Complaint
It was then suspected in the lab that the results might have been obtained from a urine (or other fluid) sample rather, which might accidentally been registered / recorded as CSF.
An MC&S (Microscopy, Culture and Sensitivity testing) was also requested on an aliquot of the sample.
History
The above result was obtained from a patient known with hydrocephalus. No other information was available at the time of analysis.
Examination
N/A
Laboratory Investigations
As above abnormal results.
Other Investigations
Microscopy: No leucocytes; No bacteria; India Ink stain was pending.
The following possibilities were thought of:
- Pre-analytical factors:
- A urine sample was sent and incorrectly registered as CSF
- A possibility to quickly exclude this was to determine the creatinine on the sample if urine, then the creatinine will measure in the thousands (umol/L) or in the mmol/L range.
- One could also do CSF identification by CSF electrophoresis for the presence of beta-2 transferrin or beta trace protein identification, but this is expensive and laborious.
- Bacteria metabolised all the glucose, and for some reason the protein did not go up in the patient, although the protein <0.01g/L is extremely low, making the possibility of this scenario unlikely.
- A urine sample was sent and incorrectly registered as CSF
- Analytical factors:
- Bubble aspiration, although the rerun gave a similar result.
- Interferents: none could be thought of in this scenario.
- Post-analytical:
- The result was obtained directly from the analyzer’s user interface, hence making transcription / translation errors unlikely.
Final Diagnosis
The clinician, a neurosurgery doctor, was phoned to enquire about the history, and it was indeed a sample from the cerebro-spinal space, but upon questioning the Neurosurgery doctor, it became known that:
- This sample was obtained intra-operatively during placement of a ventriculo-abdominal shunt for hydrocephalus
- During the procedure, the ventricles have been flushed with Normal Saline, which explains the low CSF protein and the low Glucose.
Take Home Messages
The history from the clinician was confirmation that this sample was indeed from the cerebrospinal space, although not representative of the cerebrospinal space, as it was taken during a procedure, hence likely pure saline was measured.
Adequate history from the clinician is most often the most useful information that can be obtained, especially when severely abnormal results are obtained.
When results do not make sense, one should not authorize them without discussing with the clinician first.
The neurosurgery doctor agreed that to request the chemistry on this sample was not indicated and they actually only wanted the Microbiology investigations as proof of some sort that an infection was not present, for which exact indication the Microbiology team might comment on.
Results was thus not authorized, but rather cancelled with a comment, stating that sampling was not representative of the physiological CSF.