Potassium more than 10 mmol/L on the ion-selective electrode.
Presenting Complaint
The patient was admitted in surgery after bowel surgery, on total parenteral nutrition.
History
Surgery was done due to bowel obstruction.
Examination
Not available.
Typically:
A hallmark of small bowel obstruction is dehydration, which manifests as tachycardia, orthostatic hypotension, and reduced urine output, and, if severe, dry mucus membranes.
●Abdominal inspection will identify a variable degree of abdominal distention.
●Abdominal auscultation – Acute mechanical bowel obstruction is characterized by high-pitched “tinkling” sounds associated with the pain. With significant bowel distention, bowel sounds may become muffled, and as the bowel progressively distends, bowel sounds can become hypoactive.
●Abdominal percussion – Distention of the bowel results in hyperresonance or tympany to percussion throughout the abdomen. However, fluid-filled loops will result in dullness. If percussion over the liver is tympanitic rather than dull, it may be indicative of free intra-abdominal air. Tenderness to light percussion suggests peritonitis.
●Abdominal palpation may identify any abdominal wall or groin hernias, or abnormal masses.
Laboratory Investigations
Date
16/03/2020
14/03/2020
13/03/2020
12/03/2020
12/03/2020
11/03/2020
10/03/2020
08/03/2020
Time
07:22
10:38
10:30
19:59
12:32
21:23
16:05
12:53
Na
144
141
141
δ- 138
143
δ+ 145
140
K
>10
2.6
3.0 L
3.0 L
INVH
3,2 L
δ+ 3,7
3.0 L
Cl
Urea
4.4
5,1
5.0
5,5
6,9
δ+ 5,5
2,5
Creat
47
60 L
60 L
64
67
66
62 L
Ca
1.63
2,24
2,27
2,13 L
2,23
2.30
2,23
Mg
0.38
δ- 0.67
δ+ 0.90
0.77
0.82
0.75
0.74
Phos
1.1
1.50 H
1,31
1,28
1,38
1,23
1,17
Uric acid
Total prot
CEGK
CEGK
Alb
30
39
40
Total bili
<3
3 L
4 L
Conj bili
2
INVH
2
ALT
35
28
32
AST
33
INVH
28
ALP
118
137 H
158 H
GGT
99
96 H
113 H
LD
138
δ+ 465 H
317 H
CRP
2
7
6
Table 1 – Results in bold indicative of likely EDTA contamination.
Other Investigations
Repeated results later in the afternoon:
Date
16/03/2020
16/03/2020
Time
13:04
07:22
Na
144
144
K
δ+ 3,3 L
>10
Cl
Urea
4.6
4.4
Creat
55
47
Ca
2.2
1.63
Mg
0.56
0.38
Phos
1.06
1.1
Uric acid
Total prot
CEGK
CEGK
Alb
37
30
Total bili
3 L
<3
Conj bili
2
2
ALT
46
35
AST
40
33
ALP
151
118
GGT
121
99
LD
230
138
CRP
2
2
Initial results on the right. Repeated (new) results on the left.
Final Diagnosis
Likely EDTA contamination causing a falsely elevated potassium, decreased Calcium, Magnesium and ALP. The clinician was contacted and it was indeed medical undergraduate students who had taken the bloods, probably not realizing the order of draw, or toppling up the serum blood with some of the blood taken in an EDTA tube. This is evidenced by the high potassium, low calcium, magnesium and ALP. It is however evident that most other analytes were also lower than the repeat bloods later that day, hence:
Another likely possibility of the results in question could have been drip line contamination due to a potassium-containing fluid. The patient was indeed on total par-enteral nutrition, which usually contain large doses of potassium. This could be explained by the dilution of most analytes (as opposed to the raised potassium and normal sodium).
Take Home Message
It does not require much potassium EDTA contamination to evoke spuriously abnormal results. Potassium EDTA works as an anticoagulant by inhibiting clotting by chelation of the divalent cations such as calcium and magnesium, essential for the divalent cation-dependent proteolytic enzymes involved in the clotting cascade.
Gross potassium EDTA contamination of blood samples can be recognized by unexpected marked pseudohyperkalaemia and pseudohypocalcaemia. Serum alkaline phosphatase (ALP) activity can also be reduced in the presence of potassium EDTA contamination. Additionally, aspartate transaminase, alanine transaminase, lactate dehydrogenase, creatine kinase, amylase, unsaturated iron-binding capacity and bicarbonate can all be detrimentally affected in the presence of potassium EDTA contamination. Notably, some papers report potassium EDTA contaminated samples were mainly from inpatients compared to outpatients and primary care and the authors speculated that this is because blood samples in outpatients and general practice are largely but not exclusively collected by trained phlebotomists. It is our job as laboratorians to educate the newly trained clinicians about order of draw.
It is unfortunate that I couldn’t locate the undergraduate student who had taken these bloods, but at least the attending clinician was made aware of EDTA contamination.
Discrepant TFT’s
HOSP #
WARD
Endocrine Clinic (OPD)
CONSULTANT
Dr. Jody Rusch
DOB/AGE
32 Year female
Abnormal Result
The clinician, an endocrinologist, phoned about discrepant results: Suppressed TSH, Low Free T4 and Normal (upper end of reference interval) Free T3.
Date
09/12/2020
TSH (mIU/L)
0.05 L
Free T4 (pmol/L)
4,8 L
Free T3 (pmol/L)
6,4
Presenting Complaint
The patient was known with Graves Disease complicated by quite severe Graves Eye Disease (orbitopathy).
History
Known with Graves disease with positive antibodies to TSH-receptors.
Examination
The clinical examination for this patient is not available, but the following is important:
Interestingly, patients may have no ocular symptoms at all, but may sometimes be distressed by the appearance of their eyes. The major ocular symptoms include:
A gritty or foreign object sensation
Excessive tearing that is often made worse by exposure to cold air, wind, or bright lights
Eye or retroocular discomfort or pain
Blurring of vision
Diplopia
Color vision desaturation
Loss of vision in severe cases
The characteristic signs of Graves’ orbitopathy are proptosis (exophthalmos), tearing, and periorbital edema. In more severe disease, there may be severe conjunctival inflammation and ulceration from over exposure.
Laboratory Investigations
Date
09/12/2020
11/05/2020
08/11/2019
24/05/2019
29/01/2019
10/12/2018
TSH (mIU/L)
0.05 L (Rerun 0.05)
0.02 L
<0.01 L
<.01 L
<.01 L
Free T4 (pmol/L)
4,8 L (Rerun 4.9)
65,7 H
δ+>100.0 H
48,4 H
42,7 H
44 H
Free T3 (pmol/L)
6,4 (Rerun 6.4)
19,6 H
As above, the history of Graves disease is clear, which includes a suppressed TSH and raised Free T4 and Free T3.
Other Investigations
The Free T4, Free T3 and TSH was re-run on 10/12/2020, QC checked on these three analytes (all was within normal range) and pre-analytical labeling errors excluded as far we could.
Final Diagnosis
Graves eye disease, now with hypothyroidism.
Take Home Message
In Graves’ disease, the main auto-antigen is the thyroid-stimulating hormone (TSH) receptor (TSHR), which is expressed primarily in the thyroid but is also expressed in adipocytes, fibroblasts, and a variety of additional sites and appears to be closely aligned with the insulin-like growth factor 1 (IGF-1) receptor. TSHR antibodies and activated T cells also play an important role in the pathogenesis of Graves’ orbitopathy by activating retro-ocular fibroblast and adipocyte TSHR and IGF-1 receptors and initiating a retro-orbital inflammatory environment.
The retro-orbital tissue (and ocular muscles) increase in volume due to this inflammatory milieu, fibroblast proliferation and the accumulation of hydrophilic glycosaminoglycans (GAG’s), most notably hyaluronic acid.
Sometimes orbitopathy occurs in patients with hypothyroidism (high TSH, low free T4) due to classical chronic autoimmune thyroiditis (Hashimoto’s disease), and these patients may have stimulating TSH receptor (TSHR) antibodies but inadequate thyroid reserve.
In summary, the most important factors for development of Graves Eye Disease (orbitopathy) seems to be:
Graves Orbitopathy antigen (which is the TSH-receptor): these are expressed extra-thyroidally, especially retro-orbitally.
Role of TSH receptor antibodies
Role of T-cells: Retroocular fibroblasts secrete GAG in response to cytokines such as interferon gamma and tumor necrosis factor (TNF)-alpha secreted by helper (CD4+) T cells of the Th1 type.
In cases of hypothyroidism, the action of deiodinase is increased to protect against the effects of hypothyroidism, likely the explanation of the increased Free T3 in this patient (compared to the low Free T4).
Rapidly decreasing Prolactin result
HOSP #
WARD
Endocrinology Clinic
CONSULTANT
John Stanfliet
DOB/AGE
36 y Female
Abnormal Result
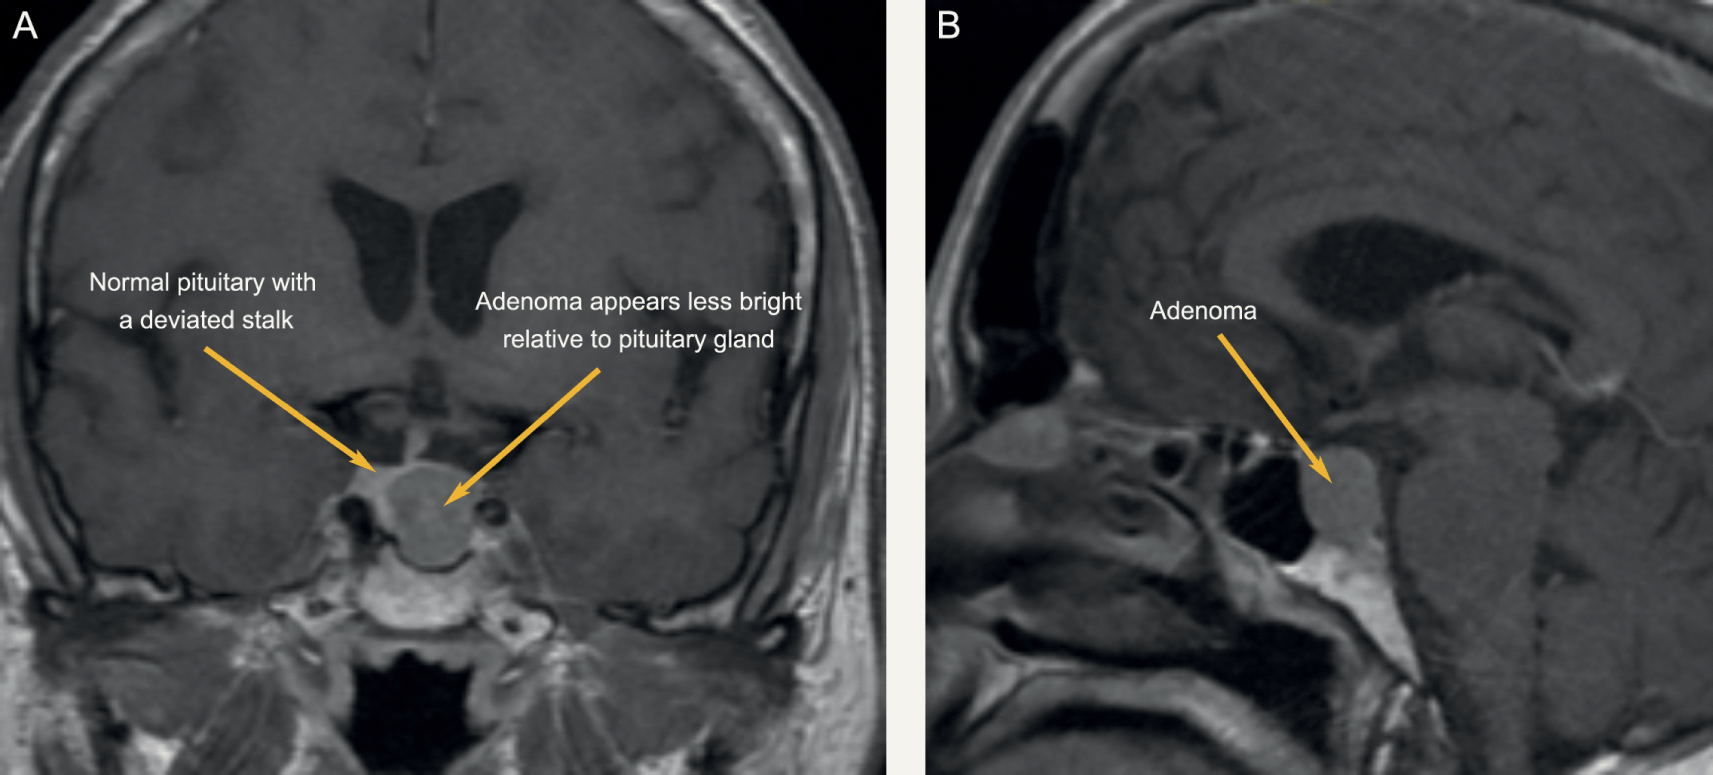
A low prolactin result was obtained in a patient in whom a macroadenoma was suspected:
Prolactin: 1.3 mIU/L
Presenting Complaint
The patient presented with headache and decreased visual acuity (more specifically peripherally).
History
There were bilateral galactorrhoea, amenorrhoea, and as noted above, headache and visual disturbances.
The patient had received Cabergoline (a dopamine receptor agonist on D2 receptors) for the past 4 months.
Examination
As above
Laboratory Investigations
Date
Prolactin (mIU/L)
02/2019
106 (Recovery of 80% following PEG precipitation)
05/2019
135
06/2019
85
08/2019
1.3 (1.59 with a 1:10 dilution; 3.94 with a 1:50 dilution)
Prolactin Results
Other Investigations
MRI Head was booked for the following week. Interestingly, even in prolactin secreting tumours, the correlation between tumour size and prolactin level is limited. MRI head remains a vital investigation.
Final Diagnosis
Pituitary Macroadenoma
Take Home Message
During pregnancy the concentration of prolactin rises under the influence of elevated estrogen and progesterone production. The stimulating action of prolactin on the mammary gland leads post partum to lactation. Hyperprolactinemia (in men and women) is the main cause of fertility disorders. The determination of prolactin is utilized in the diagnosis of anovular cycles, hyperprolactinemic amenorrhea and galactorrhea, gynecomastia and azoo-spermia. Prolactin is also determined when breast cancer and pituitary tumors are suspected. As in this case, a pituitary tumour was suspected, hence the repeated prolactin results.
As was noted in another short case, our assay on the Roche platform does measure all forms of prolactin, and when a high result is obtained (above the gender-specific reference range) it is recommended to measure the recovery after PEG precipitation.
Dr. John Stanfliet (pathologist at Pathcare) repied to the above case with very valuable comments:
We use Beckman Coulter DxI, an immunoassay that is not affected by macroprolactin (I’ve include an article that shows this).
Even in prolactin secreting tumours, the correlation between tumour size and prolactin level is limited. MRI head remains a vital investigation.
Some prolactin secreting tumours also secrete other pituitary hormones such as growth hormone.
I would ascribe the reduction in PRL to the Carbegoline and wonder whether the dose has been increased.
Dr. Pete Berman would often suggest a mixing study: find a sample with high PRL, mix it 50/50 with this sample, and measure it to see whether there is some interferant in this sample.
Patient presented with signs and symptoms of iron deficiency anemia.
History
The patient is a known hemophilia B carrier (Factor IX deficiency or Christmas disease) with menorrhagia and accompanying iron deficiency anemia.
Examination
The patient presented to the emergency rooms with symptoms of severe weakness and had occasional severe menorrhagia.
Unfortunately the physical examination details are not available.
Laboratory Investigations
Iron: 4.5 umol/L (9-30.4) Low
Transferrin 3.92 g/L (2-3.6) High
% Saturation 5% (15 -50) Low
Ferritin 8 ug/L (13- 68) Low
Other Investigations
Anti-Thyroglobulin (anti-TG) antibodies as well as Anti-Thyroid Peroxidase (anti-TPO) antibodies were positive in this patient.
These antibodies was suggested after the results of the TSH and reflexed free-T4 became available and hence after-requested.
Final Diagnosis
The pattern of significantly raised TSH with the significantly low free-T4 and the raised anti-TPO and anti-Thyroglobulin antibodies suggest primary hypothyroidism.
Take Home Message
It’s always worth doing a TSH to screen for thyroid disease when a patient presents with weakness / tiredness, irrespective of the age.
Primary hypothyroidism due to an auto-immune mediated destruction of the thyroid gland tissue is the most common hypothyroid condition and is confirmed by measuring the common anti-thyroid antibodies: Anti-TPO and Anti-TG antibodies. There is likely not much indication for performing these antibodies more than once after diagnosis of hypothyroidism and some clinicians argue it not necessary to even perform these antibody measurements.
Congenital hypothyroidism is one of the congenital disorders causing cretinism which is most preventable by newborn screening. Even though not likely congenital in this patient, it’s worth considering on the differential diagnosis.
The patient was on iron supplements as well as Factor IX injections. I was not aware of an association between Factor IX deficiency and Hypothyroidism, but my Haematology colleagues across the corridor told me the following:
Factor IX deficiency is an X-linked recessive disorder. This makes it unlikely for a female to get this disease. Auto-immune diseases is much more likely in females. There is also a form of Christmas disease where one produces antibodies to factor IX, which yields it inactive, hence presenting as Factor IX deficiency.
This, although unlikely, presents an interesting thought for this unusual presentation in this 16-year old female. Acquired deficiencies of most clotting factors have been described.
However, upon discussion with the attending clinician it seems that the patient did have a clear family history of Christmas disease, hence the presentation.
A case of Cryptococcal meningitis with hypomagnesemia
HOSP #
WARD
Victoria Hospital Female medical ward
CONSULTANT
Heleen Vreede
DOB/AGE
29y female
Abnormal Result
The magnesium result measured 0.36 mmol/L ( 0.63 – 1.05 mmol/L) despite adequate levels prior to admission to hospital (0.75 mmol/L on 18/04/2020).
Presenting Complaint
The patient was asymptomatic with regards to the at the time when the result was obtained.
History
Patient was diagnosed with Cryptococcal Meningitis on 22/04/2020 with a cryptococcal latex agglutination test.
Patient was known HIV positive with a CD4-count of 9 cells/uL (332-1642).
Examination
Unfortunately this data is not available.
The clinical features of hypomagnesemia is predominantly related to the derangement in the calcium becoming deranged when hypomagnesemia occurs.
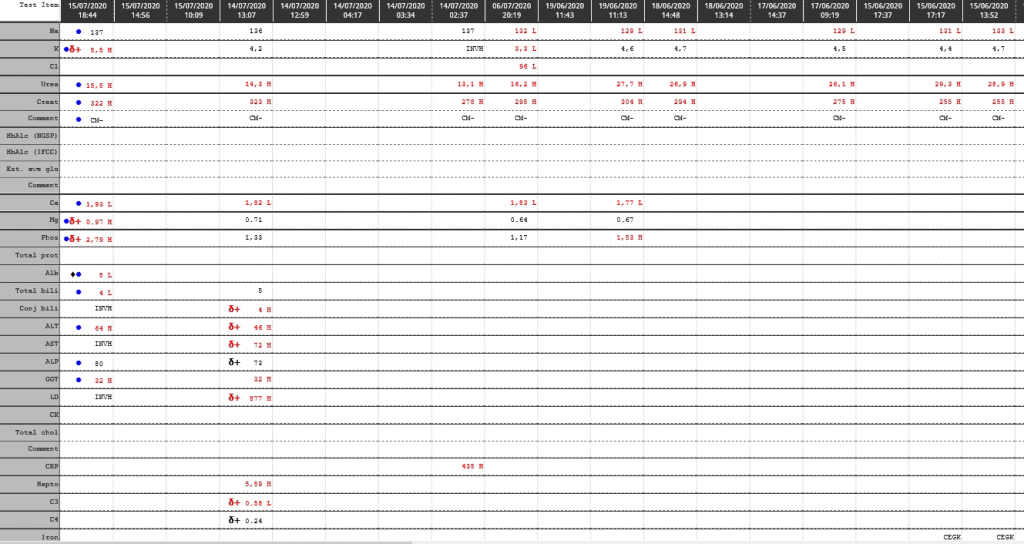
Laboratory Investigations
Other Investigations
None available.
Final Diagnosis
Hypomagnesemia with accompanying hypocalcemia due to Amphoterecin B therapy
Take Home Message
I’ve learned from the attending clinician (and a short literature search) that Hypomagnesemia is a known consequence of Amphotericin B therapy.
Hypocalcemia is often a consequence of hypomagnesemia (as in this case). This is due to two known mechanisms:
Decreased sensitivity of Calcium at the calcium-sensing receptor, with decreased secretion of PTH and hence its effects.
Decreased action of PTH due to PTH-receptor resistance being caused by hypomagnesemia.
Stata destring with removing weird characters
STATA destring with only keeping numeric numbers
The newest solution to this problem is:
egen-method as described below followed by:

replace problemvar = subinstr(problemvar, ",", ".",.)
https://www.stata.com/statalist/archive/2009-05/msg00862.html

followed by:
destring problemvar, replace *without the 'dpcomma' option.


Dieter Van Der Westhuizen
Mon 2020-07-27 03:01 PM
Sent Items
To:Jody Rusch (jody.rusch@nhls.ac.za);
Follow-up from my previous email:
*This command works when one has either comma or period in the field:
destring kknew3, replace dpcomma
Dieter Van Der Westhuizen
Mon 2020-07-27 02:39 PM
Sent Items
How to strip special characters in STATA variables:
Type the following:
***********************************
program define extrnum
version 7
syntax varlist(max=1) , gen(str)
local maxlen: type `varlist'
local maxlen=substr("`maxlen'",4,.)
tempvar work
qui gen str1 `work'=""
forvalues i=1/`maxlen' {
qui replace `work'=`work'+substr(`varlist',`i',1) if real(substr(`varlist',`i',1))<.
}
gen `gen'=real(`work')
end
*************************************
How to use:
extrnum var1, gen(newvar1)

It works perfectly except it drops the commas too:
**Thus use:
findit egenmore
**and install the app “egenmore” by following the instructions.
**Then one can specify to keep the following characters:
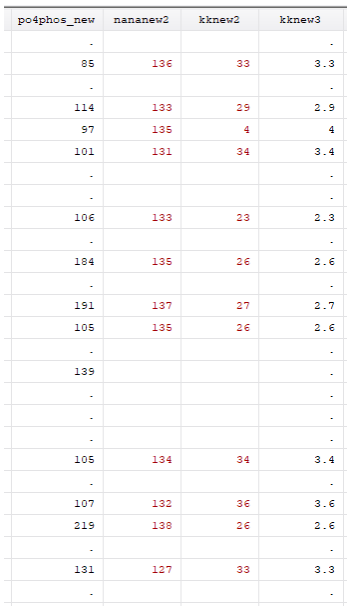
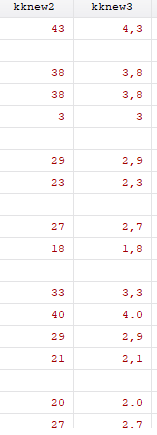
egen kknew3 = sieve(kk), char(0123456789.,)
**Which lets you end up with this:
Destringing this doesn’t work yet, as some characters have “.” and others have “,”
Dieter Van Der Westhuizen
Mon 2020-07-27 11:30 AM
Sent Items
Dieter van der Westhuizen Chemical Pathology RegistrarC17 NHLS Pathology Laboratory, Groote Schuur Hospital and Red Cross Children’s Hospital LaboratoryTel: 021 404 4135 | Cell: +27 82 861 2093 | Fax-to-email: 0866 090 397dieter.vdwesthuizen@nhls.ac.za | www.nhls.ac.za
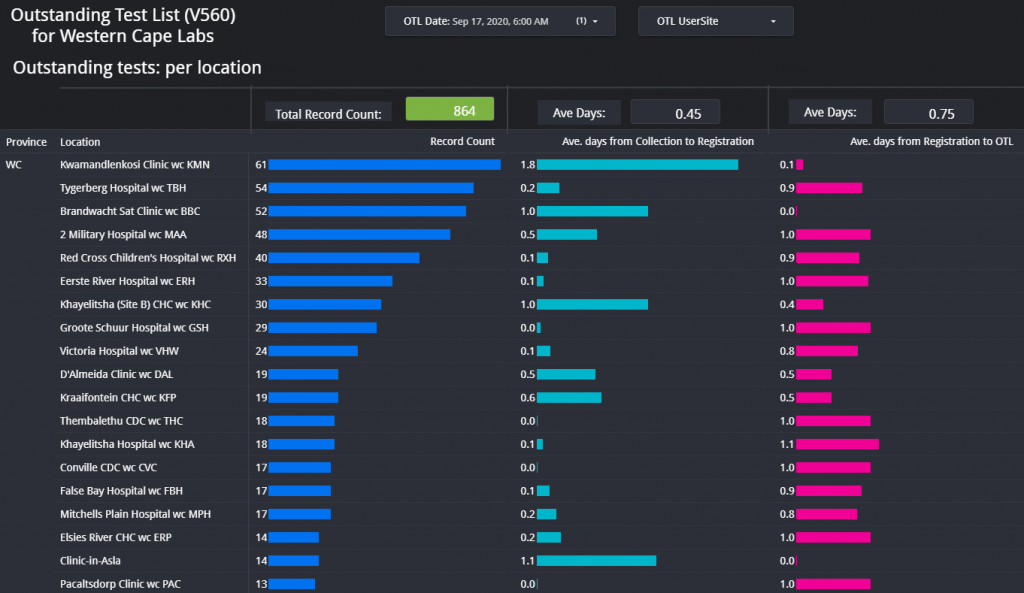
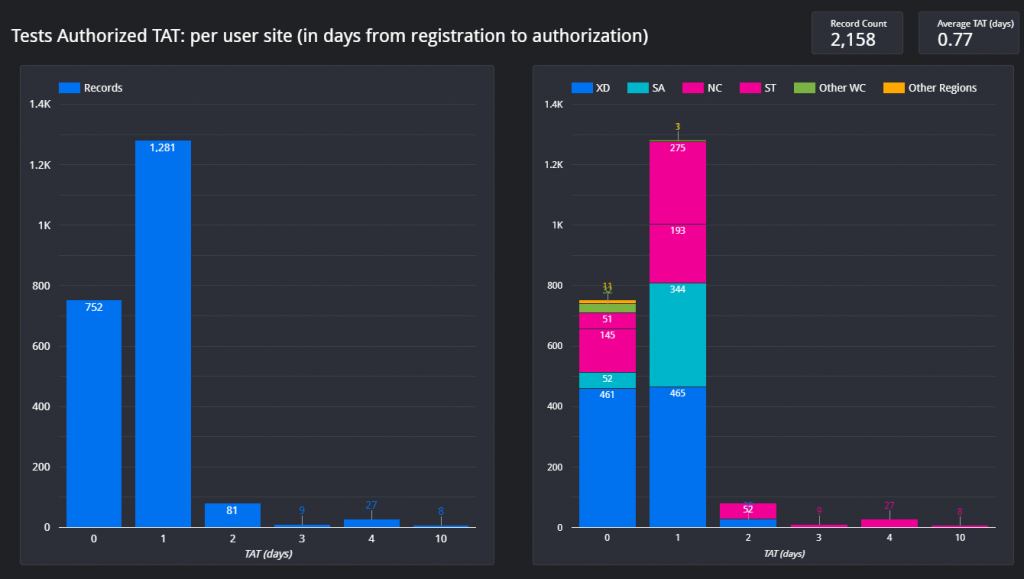
Section 7.8 – COVID OTL Dashboard
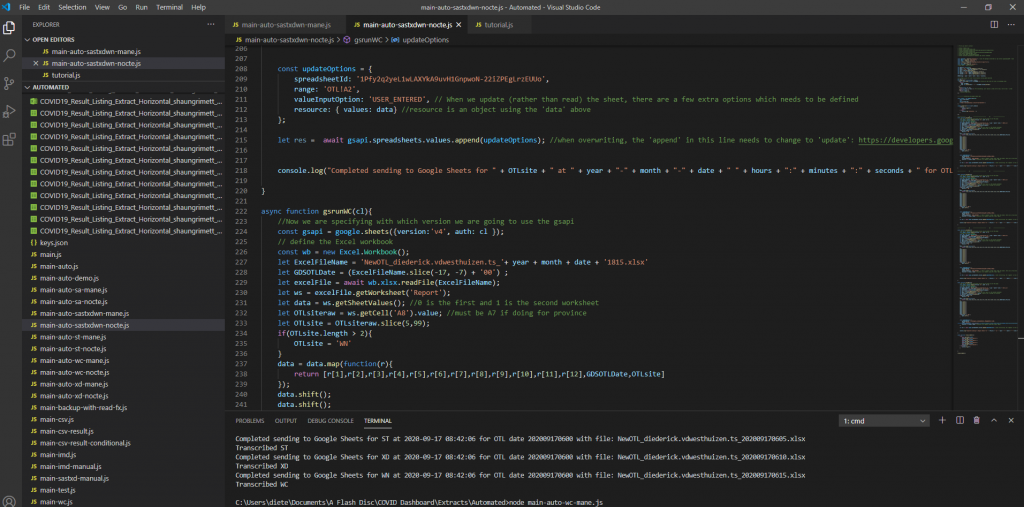
A dashboard was created to visually represent the COVID outstanding test list for our province for COVID outstanding PCR tests. This dashboard has been requested by the area manager of the Western Cape and various others on the Virology Expert Committee. Even though not a task primarily assigned to chemical pathologists, since I have an interest in data science, I tried to help. The end result was a dashboard which is updated every morning at 06h00 and every evening at 18h00 with a few JavaScript scripts running each day, updating three databases on the backend along with automated data extractions being done from TrakCare every morning and evening at a predefined time.
Screenshot 1 – Illustration of the JavaScript code to read the extracted Excel (or CSV) files and transcribing them to a Google Sheets database.
This dashboard was used (and likely still are being used) especially by the virologists at Groote Schuur Hospital to track the progress of outstanding COVID PCR tests and it can also be used to show possible bottlenecks in pre-analytical sample issues if tests are already registered before being sent to any of our laboratories in the Western Cape.
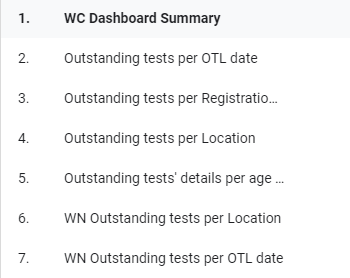
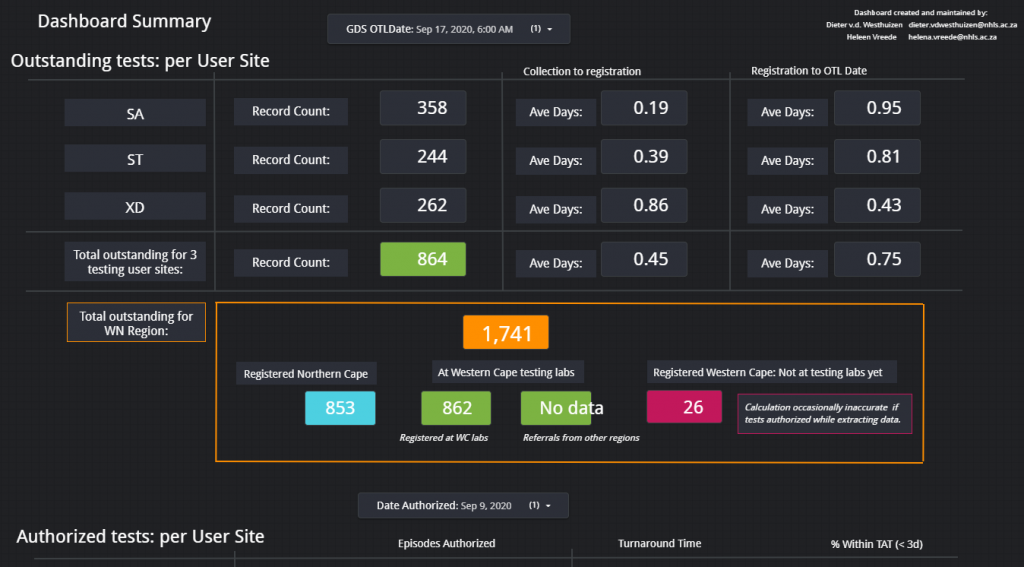
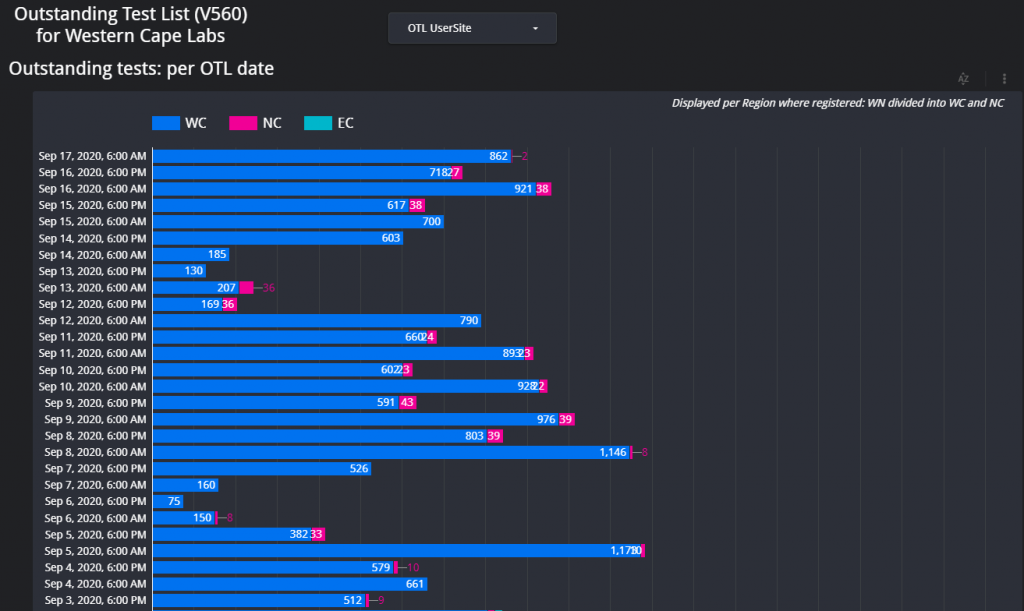
Figure 1 – Screenshot of the Dashboard. Follow the link above to view.Figure 2 – Example of the layout of the page which shows the total count of items on the respective outstanding test lists for each respective data for the Western Cape.Figure 3 – Outstanding tests summary by location. This page is especially helpful if the delay / outstanding tests from a specific hospital or clinic needs to be visualized in comparison with other locations (hospitals / clinics).Figure 4 – Illustration of the turnaround time met by a certain count of samples per each respective user site for one day.
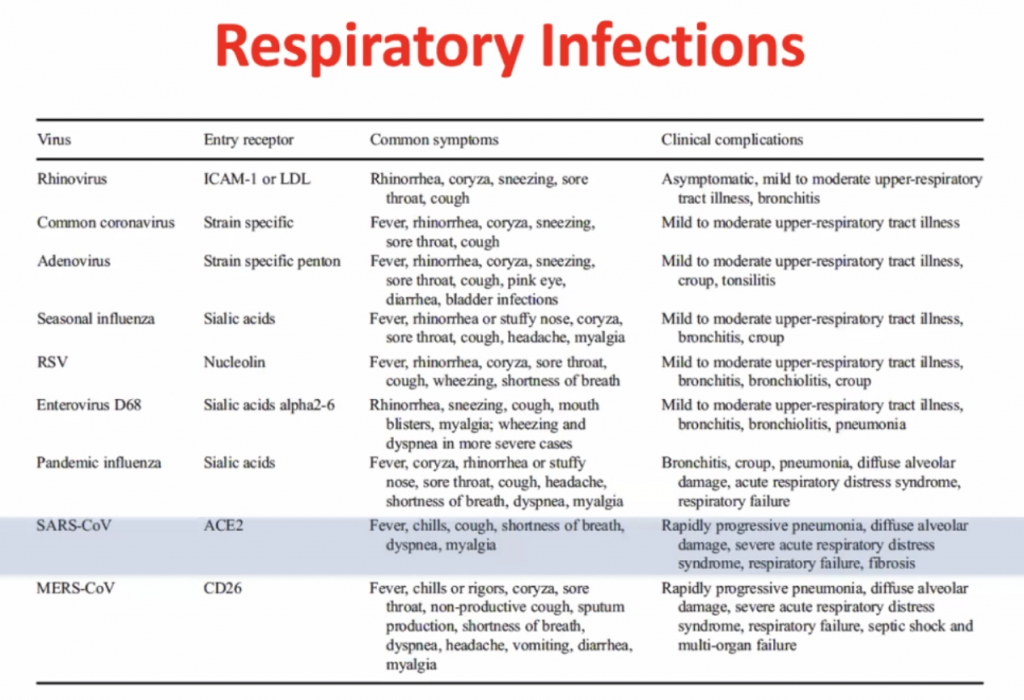
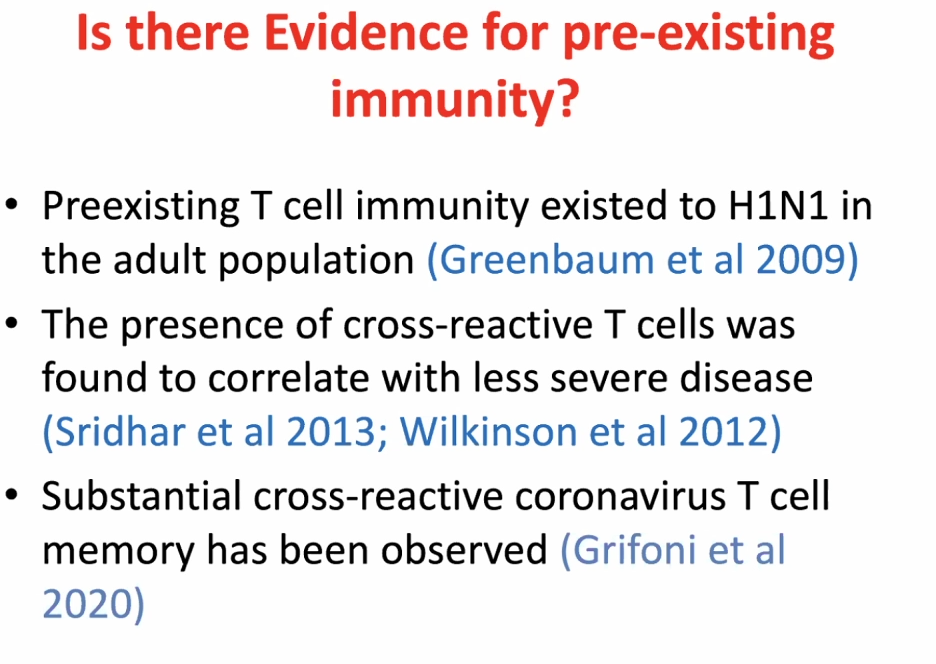
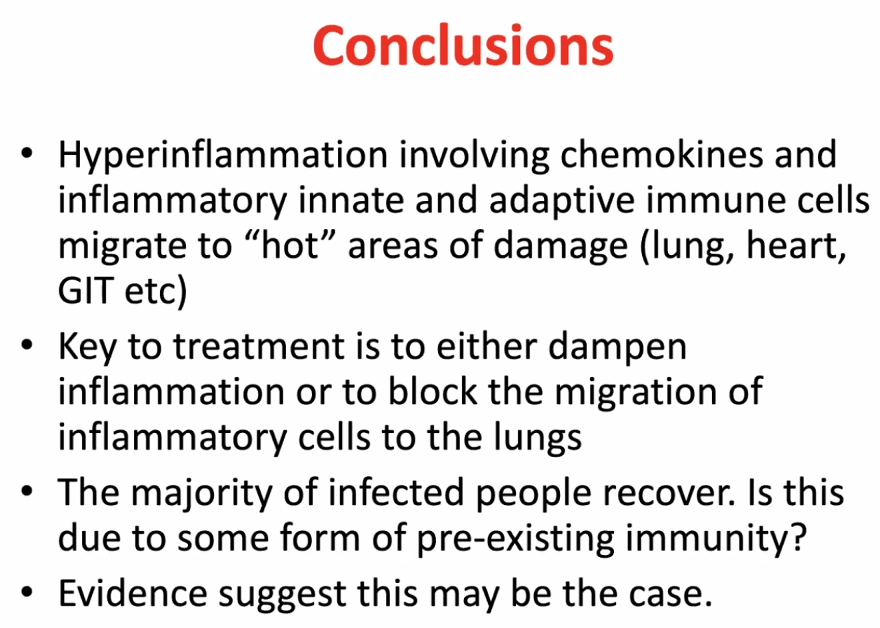
Immune Responses to SARS-CoV-2 cause severe COVID-19 in some and recovery in most
Clive Gray – Professor in Immunology immunopaedia.org – useful web site for immunology resources.
Outline:
Basics of Immunology
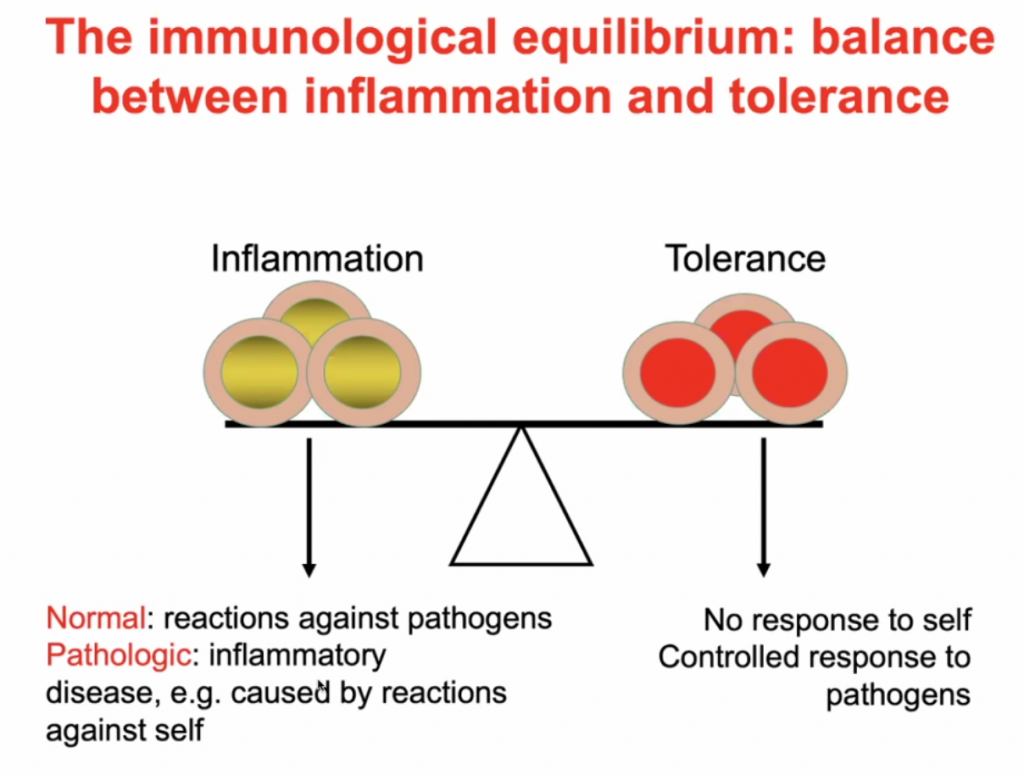
A balance between inflammation and tolerance
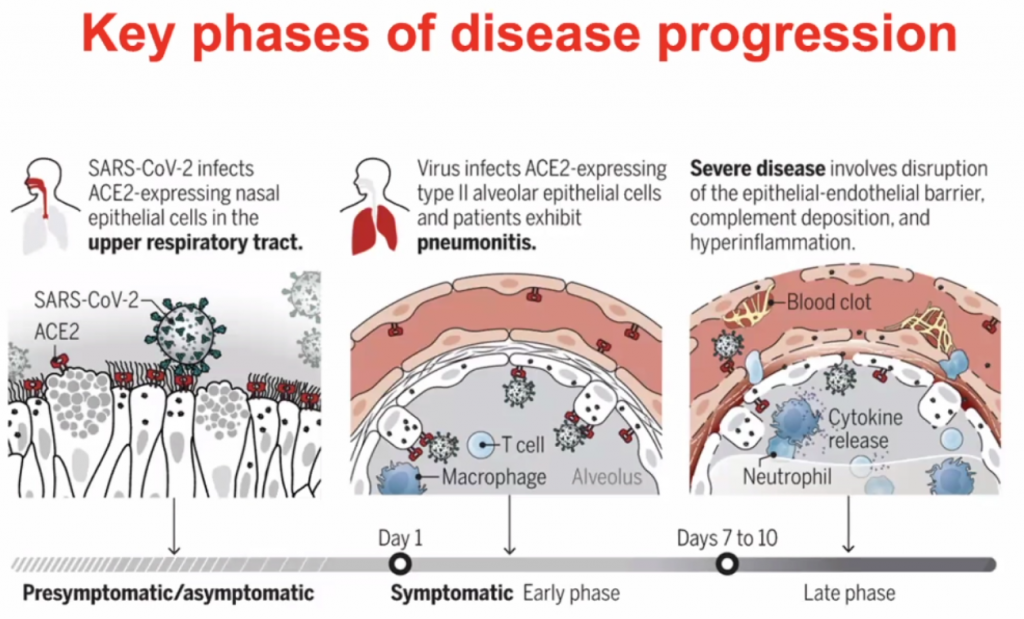
What happens to people who progress to severe COVID-19?
What might be happening in SARS-CoV-2 infected people who remain asymtomatic, have few symptoms and recover?
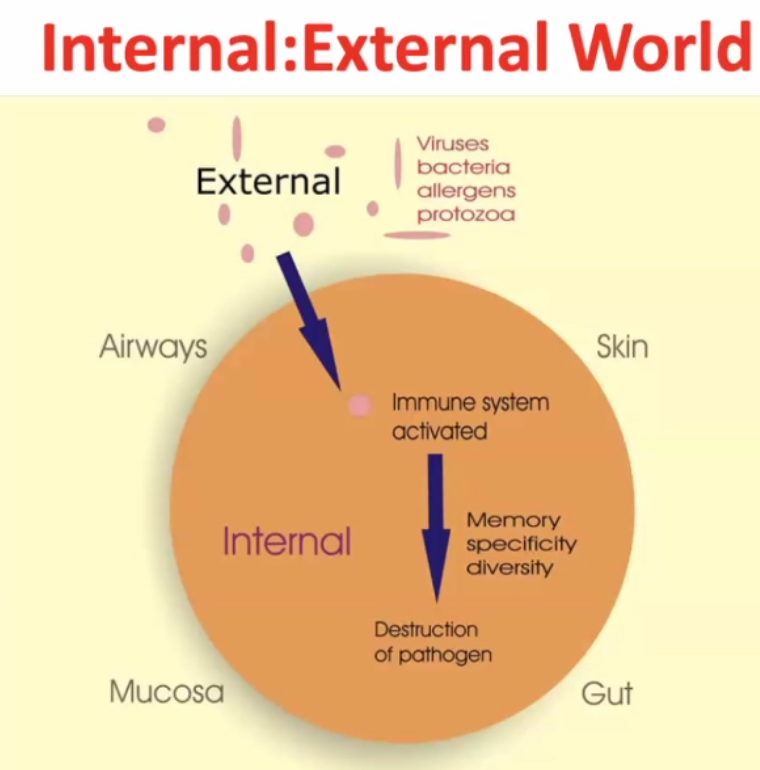
Internal : External world
~99% of time the pathogen gets destructed, but the pathogen may survive in rare cases.
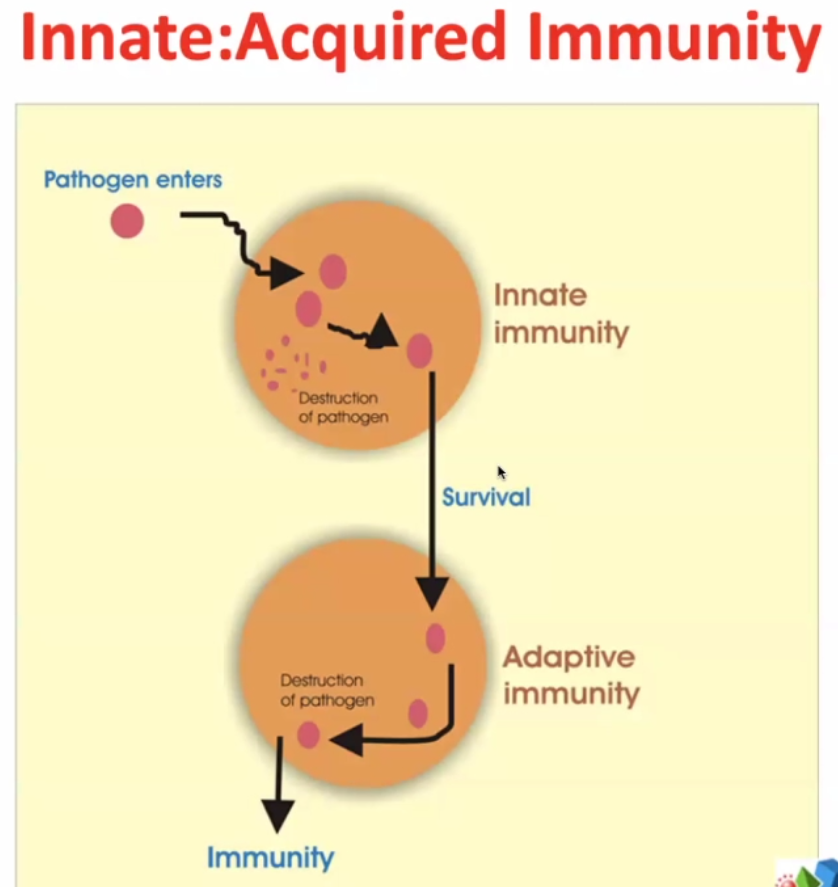
2 arms of immune responses:
Innate – evolutionary response – very rapid – elements of innate immunity are found in bacteria, plants, lower vertebrates, squids, fish etc.
Some pathogens survive ->
Adaptive immunity – much more targeted / focussed. The immune system targets more specifically the pathogens which survive the innate immunity.
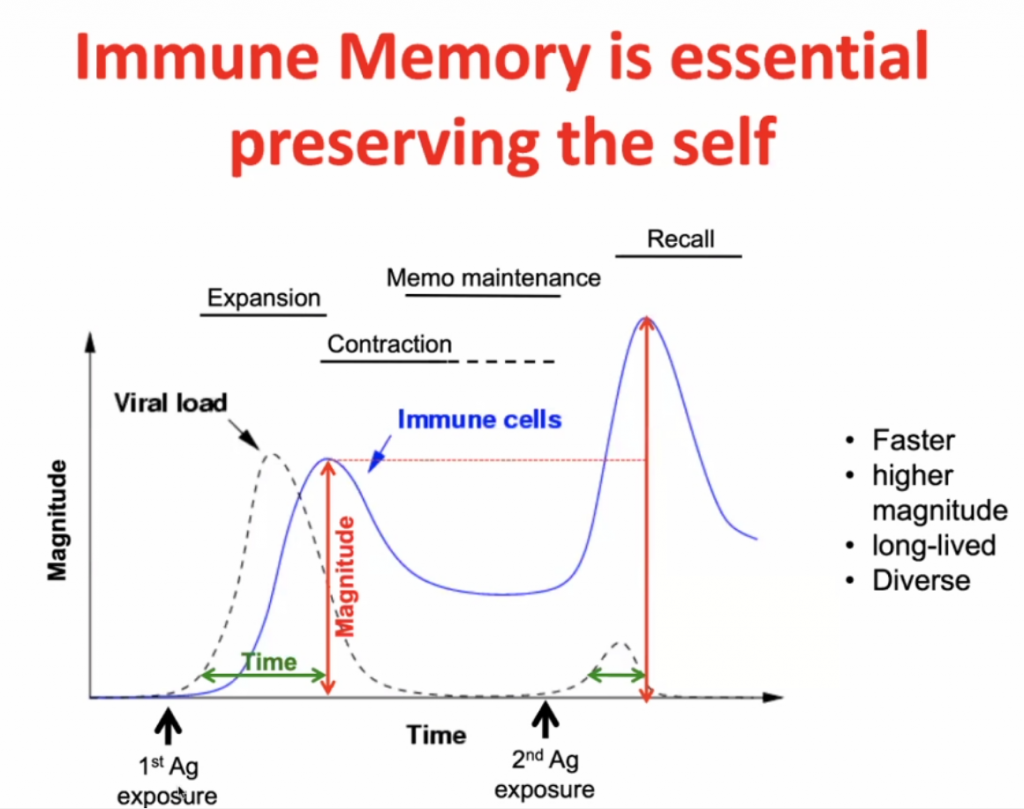
Infection initially -> expansion (peak after maximal viral load) -> contraction with some residual immunity (Memo Maintenance) -> with secondary response (Recall) there is a more rapid expansion (and higher peak) of the specific immunity.
Immune regulation:
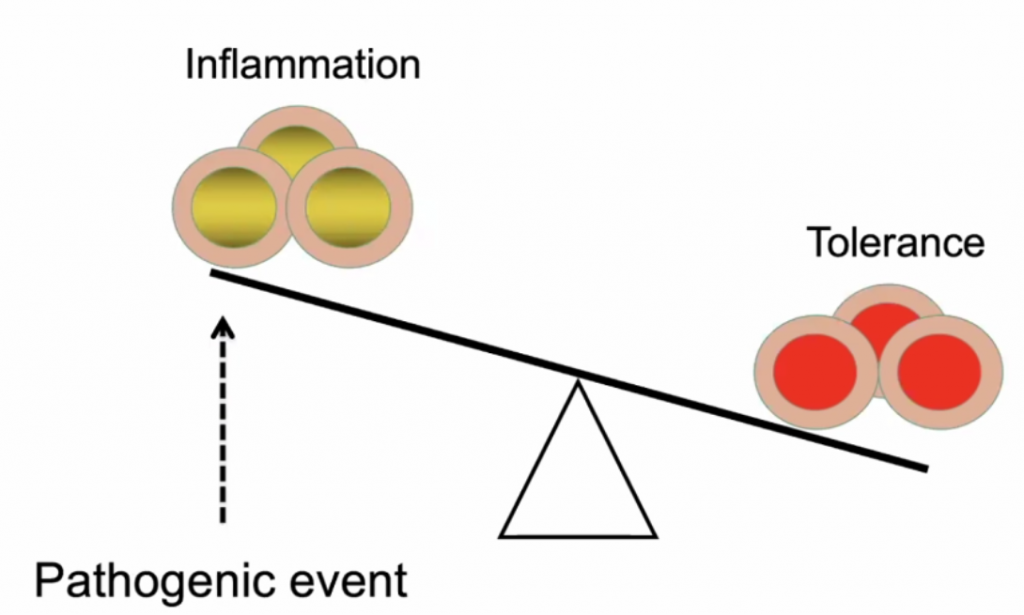
Predisposed conditions: DM, HPT, Obesity, would make an individual highly susceptible to inflammation due to in imbalance of Inflammation vs. Tolerance, see below.
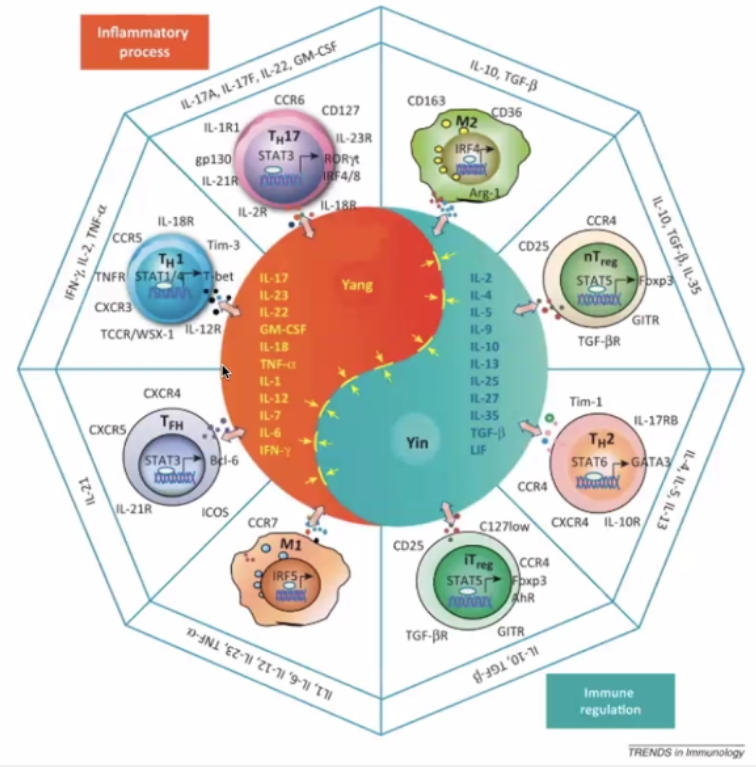
The Yin Yang of immunology:
Yin – immune regulation; Yang – Inflammatory Process
Pro-inflammatory (Orange)
TH17 – inflammatory cells secreting the “calling signals” for leucocytes.
Macrophage – presents antigens – in lymph nodes and germinal centres
T-Helper cells T-FH
Immune Regulation (Blue)
TH2 – hand in hand with TH1 (opposite)
Regulatory cells (nT and iT regulatory cells)
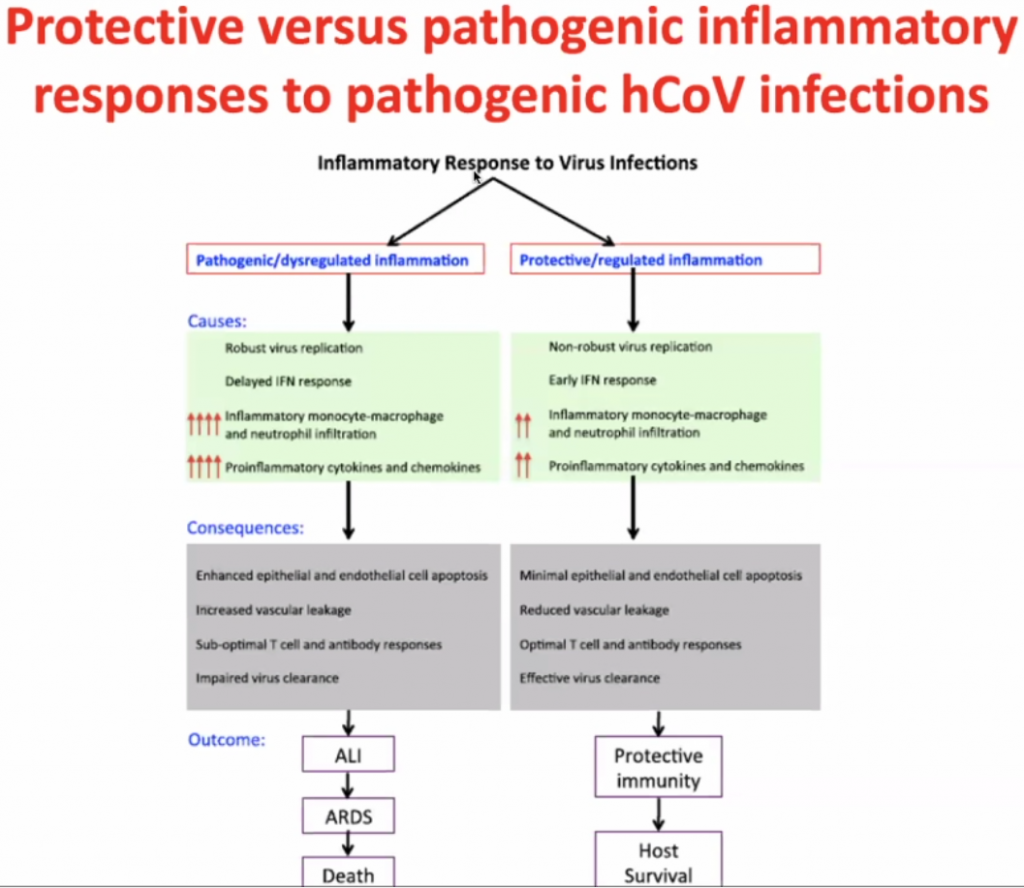
Actual pathogen is not causing disease – but the immune response – thus this is what should be focussed on to treat the disease.
Dose of the virus (viral load) is key to how you respond to the virus – Initial High dose in viral load likely will lead to high inflammatory response; Low dose (non-robust virus replication) may cause a less severe inflammatory response.
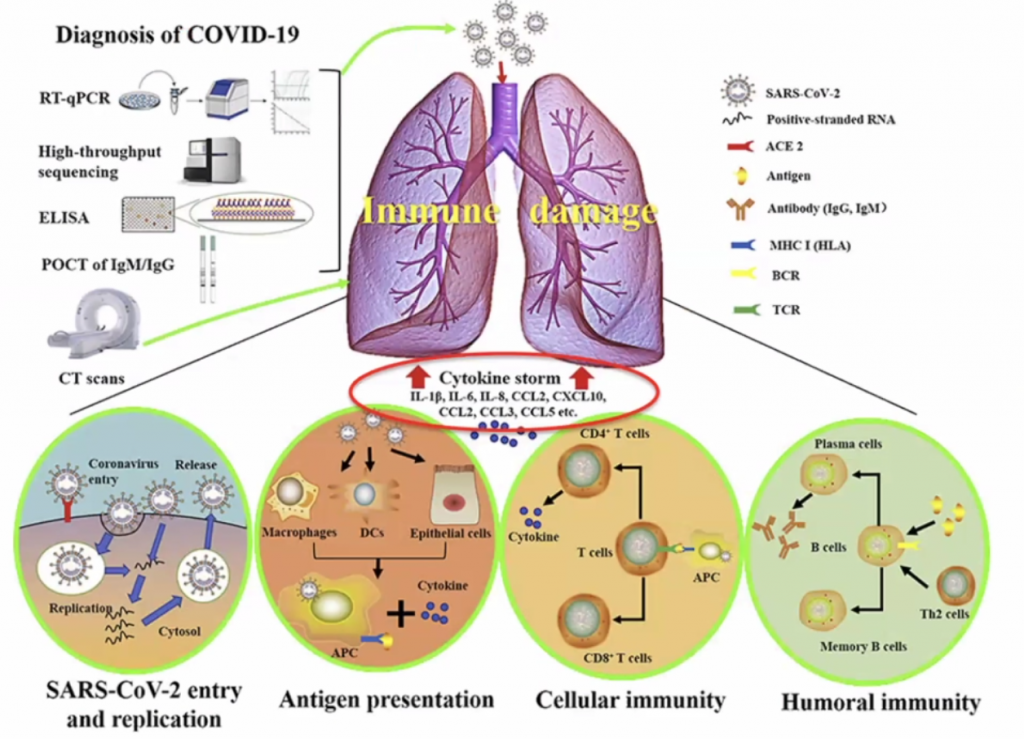
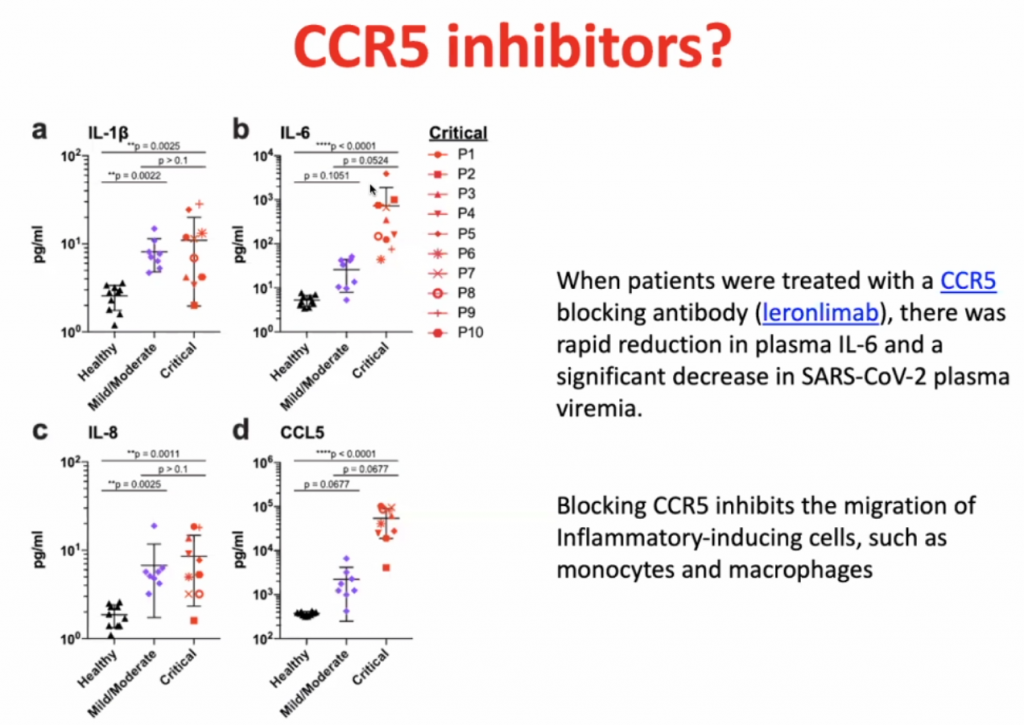
CCL’s allow leucocytes to migrate, hence in a cytokine storm, with high level of migration, the leucocytes causes severe local inflammation due to migration of leucocytes to local sites.
CCL5 blocking antibodies leads to rapid reduction of IL-6.
Dexamethasone is not so much an inhibitor of CCR5, but it prevents the hyperinflammation by inhibiting the majority of the inflammatory pathway.
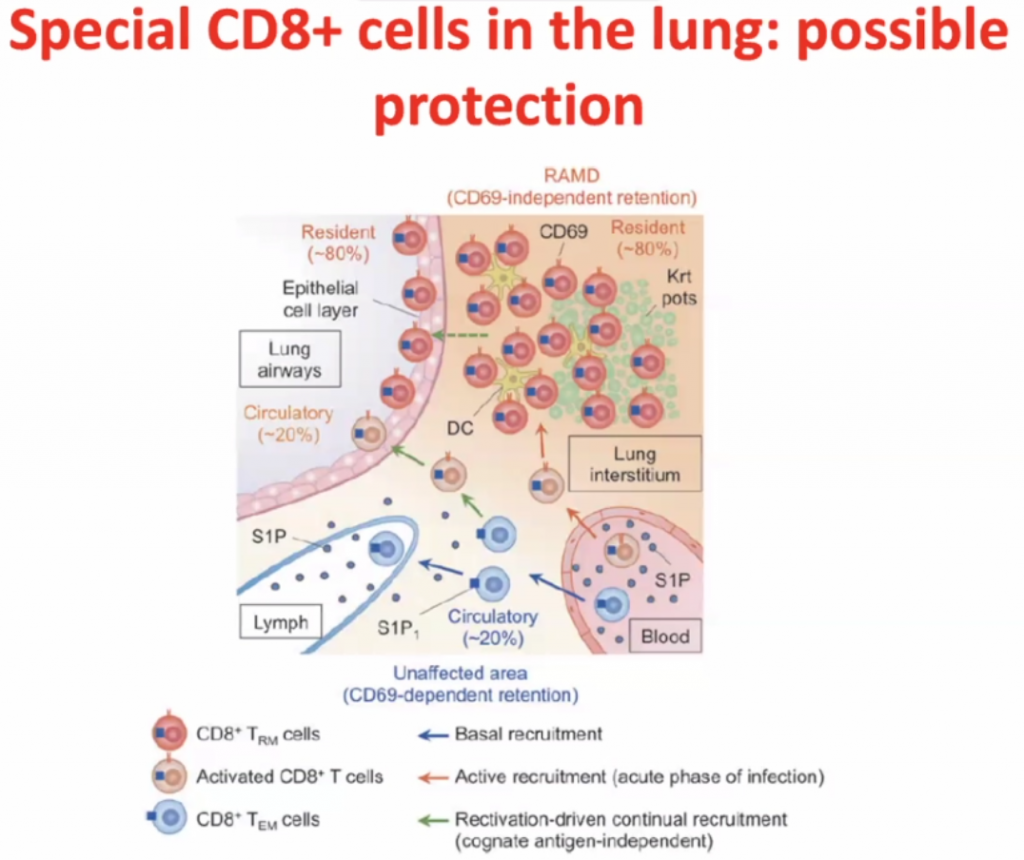
CD8 cells
Within interstisium, the CD8 cells are present and
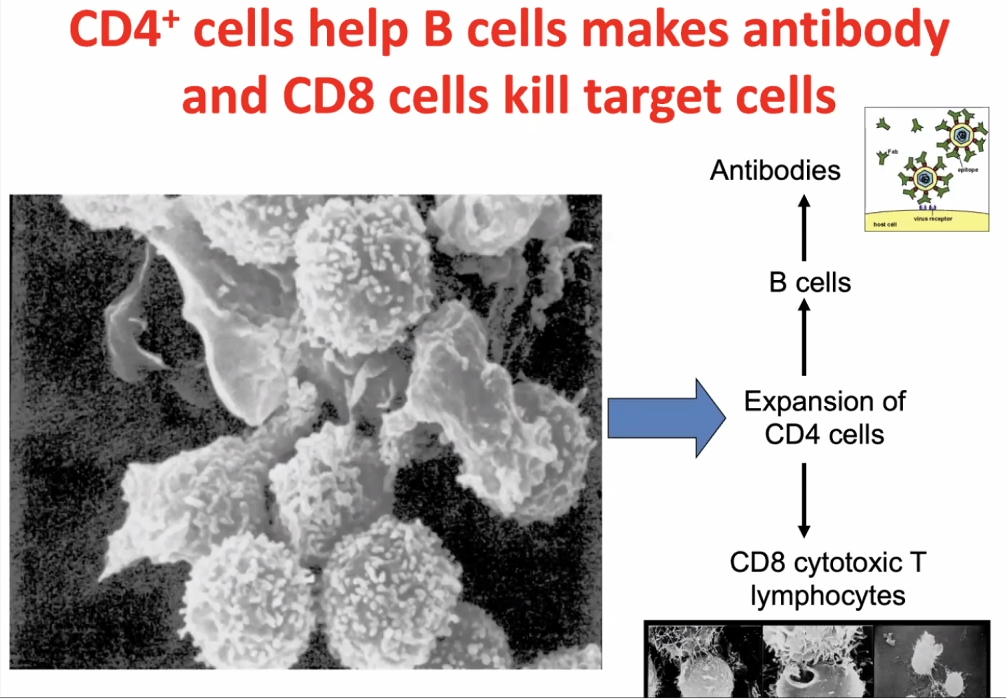
CD4 cells activates CD8 cells, hence called T-helper cells.
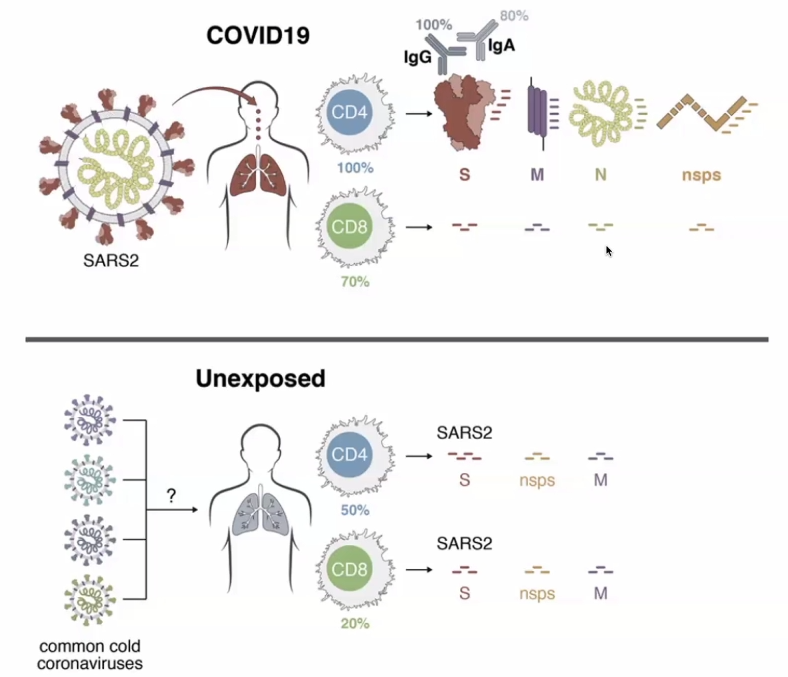
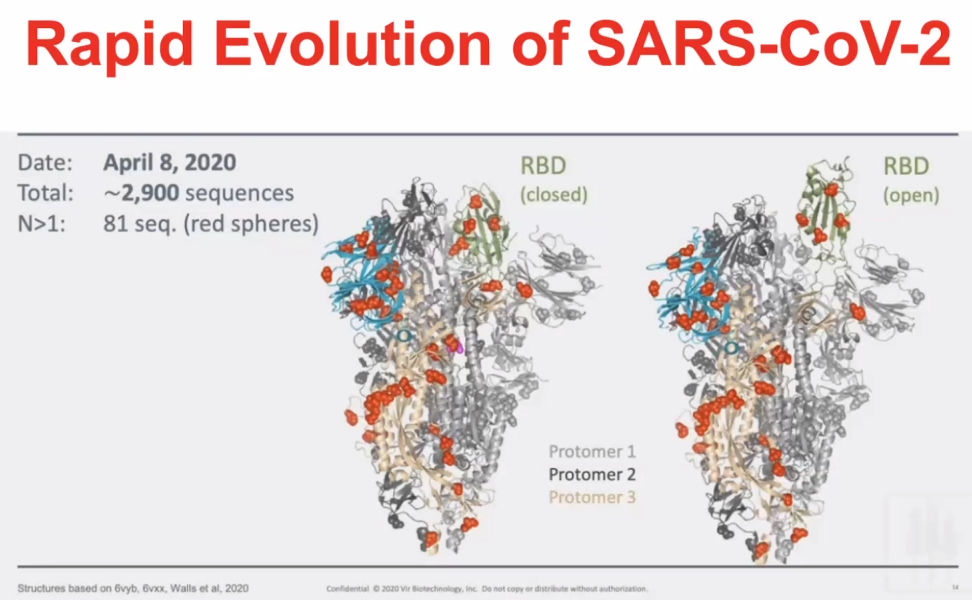
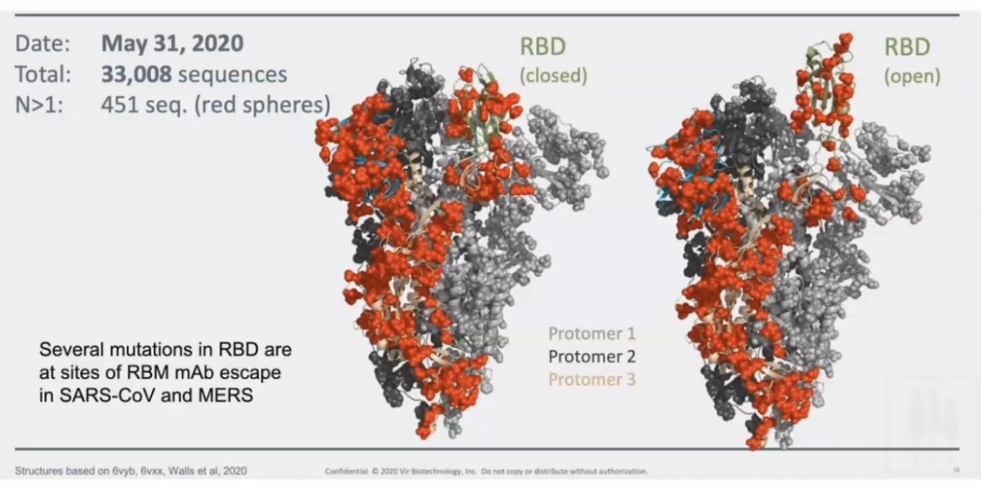
T-cell responses are very prevalent to COVID-19 exposed individuals. BUT CD4 cells and CD8 cells can also react to the SARS2 viral proteins in unexposed individuals.RBD – receptor binding domain (Spike-protein); Orange is the amount of amino acids which are changeable.Orange amino acids are those which are changeable – illustrating how the virus has mutated in a month.
A pepper-pot skull?
HOSP #
WARD
General Practitioner Practice in Robertson
CONSULTANT
Dr. Jody Rusch
DOB/AGE
83 year Male
Abnormal Result
Serum protein electrophoresis demonstrates a 4.4 g/L, IgG kappa monoclonal peak in the gamma region.
Presenting Complaint
Complains of bilateral hip pain and RUQ discomfort.
History
Atrial fibrillation on Xarelto.
2 x CABG
Examination
RUQ pain and tenderness
Hear rate regular
Laboratory Investigations
Urine protein electrophoresis: No Bence Jones protein
Serum free light chains:·
Kappa 62.87 mg/L (3.30-19.40)·
Lambda 19.63 (5.71-26.30)·
K:L ratio 3.20 (0.26-1.65)
Creatinine 108 (eGFR 56)
Calcium 2.42 mmol/l
Albumin 40 g/L
Hb 12.7 (11.0-16.0)
Other Investigations
U/S shows gallstones.
X-Ray of pelvis shows “sclerotic changes to both hips and pelvis”
Final Diagnosis and Take Home Message:
1. What is the likely diagnosis
This 83 year old male with multiple co-morbidities presenting with signs and symptoms suggestive of multiple myeloma, confirmed on SPE as IgG Kappa.
CRAB criteria before performing SPE: C- R+ A- B+ (2/4)
Bony pain could be secondary to lytic bone lesions associated with MM, but also possibly to due sclerotic/ wear-and-tear when considering his age. RUQ pain is likely due to gallstones.
Renal impairment – this is probably normal renal function for an 83 year old man
In medicine generally an eGFR < 60 is representing renal impairment (stage 3)
However, in monoclonal disease eGFR < 40 or serum Cr > 177 is the cut-point
Bone lesions – myeloma classically causes lytic bone lesions, e.g. “pepper-pot skull”
It was suggested that the clinician talks to the radiologist as to whether the X-Rays were in keeping with myeloma.
2. Critically discuss whether this patient needs a bone marrow biopsy.
The patient’s age along with co-morbidities would concern any drastic intervention:
he will be an anesthetic risk for BM Bx to be performed in theatre (assuming that is standard procedure), and
will the BM biopsy give add anything further to the already established IgG Kappa diagnosis, which can be treated accordingly.
The case should ideally be discussed with Oncology. A bone marrow biopsy is done under local anaesthetic. The bone marrow will allow the haematologist / oncologist to assess the degree of marrow clonal infiltration. The important cut-offs are 10 & 60%. This is important to decide on diagnosis, stage, prognosis, treatment and later, the response to treatment. The criteria for doing a bone marrow biopsy at our centre are:
Positive CRAB·
IgG monoclonal peak > 15 g/L·
IgM or IgA monoclonal·
FLC K:L > 10
Why is there a lower (10%) limit for degree of marrow clonal infiltration? Is there a link to immunoparesis? One likely always has some clonal expansion in bone marrow, probably a normal or a non-pathological finding.
3. Discuss the serum FLC in the setting of the renal impairment.
FLC are filtered and reabsorbed by the nephron under normal circumstances, along with other LMW proteins. During a plasma cell dyscrasia, the nephron is overwhelmed by the amount of FLC (stemming from monoclonal origin), can cause renal impairment. Hence, renal function being part of the CRAB criteria. Furthermore, renal impairment itself (in the absence of MM), can cause elevated Kappa and Lambda FLC – usually with a slight higher ratio =3.2.
In patients with renal failure, there is greater retention of serum free light chains. It is difficult to interpret ratios ranging between 1.65 – 3.0 in the context of renal insufficiency. In such cases, further investigation with a 24-hour urine protein electrophoresis and urine immunofixation helps to guide interpretation. If both of these subsequent studies are normal and the patient has no other symptoms suggestive of a plasma cell dyscrasia, then the increased ratio is likely due to the renal insufficiency.
4. Discuss electrophoresis briefly.
Electrophoresis is a general term that describes the separation of charged particles/ ions under the influence of an electric field – in this case the charge of proteins. Migration of proteins is based on their charge, size and velocity (product of their mobility and field strength) Make sure you understand why the proteins are charged the importance of NET charge and how we keep those charges stable in the field. If I can take a crack at this: The overall NET charge of the molecule is based on the number of elements (incl. amino acids with varying side-chains moeities) (I think this is the confusion when some mention that electrophoresis is based on charge, and also size. I don’t necessarily think that the two are synonymous), and each amino acid has different degrees of charge based on their differing R-group. The stability of the charges within the field is achieved by running the sample solution through a buffer. Right about the buffer. Remember that size and charge are two different physical aspects that you can use to separate molecules. For example, a DNA gel is a separation purely based on size. The net charge is the same on all the molecules. The net charge in proteins is from the side chains, which is why you have to learn about neutral, acidic and basic amino acids. The side chains have different pKa’s and so are charged differently.
a. What is the difference between capillary and gel electrophoresis. Explain which your lab uses and why.
What I described in Q4 was basically the concept of gel electrophoresis where agarose gel is used as the medium in which the proteins are separated according to their size, charge, and interaction with the medium itself. At TBH we use gel electrophoresis, but will soon be getting a Minicap/ CZE. CZE: As with gel electrophoresis, CZE also separates ions based on their electrophoretic mobility with the use of an applied voltage – all dependent on the charge of the molecule, viscosity and particle size. CZE’s voltage is much higher compared to GE – quicker results. The buffer/ mobile phase of CZE uses an electrolyte filled capillary, where eletro-osmotic flow (EOF) is generated: similarly sized and charged ions move together and are subsequently separated and detected at different time intervals.The more voltage you apply the faster the separation occurs. However, the limiting factor is that applying high voltages generates a lot of heat which can denature proteins, thereby altering their conformational shape and changing their NET charge. Capillaries are much more effective at shedding heat as they are long and thin. Thus, very high voltages can be applied and the run time is much shorter. In gel electrophoresis, you measure how far the molecules travel in a set time, e.g. 1 hour. In capillary electrophoresis, the distance that the molecules move is set and so you measure the time it takes for the molecules to travel that set distance (like running a 100m race).
The way I reconcile how the CZE differential seperation works is by the
driving force of the buffer through the tubing (forward force)
negative charge on the side of the tube (retarding force)
NET charge on the molecule (many amino acids=higher charge, eg Albumin) (determine degree of retardation of flow)
Voltage powers the whole system
5. Why is the serum FLC abnormal but not the urine protein electrophoresis?
UPE’s sensitivity is limited due to the reabsorption of FLC in the renal tubules. FLC in urine will only be detected until loss of tubular function/ tubules are overwhelmed by FLC volumes. This patient’s Kappa FLC of 63 mg/L in serum should be detected on UPE, but tubular function is seemingly still intact with little being excreted.
Some are of the opinion that SPE and SFLC is the preferred method to screen for myeloma because of higher sensitivity and specificity, as opposed to SPE and UPE, which may have a slightly lower sensitivity.
It should however be noted that quoted sensitivities and specificities are usually based on retrospective audits of patients who eventually end up in a myeloma clinic. So, it is not sure what the sensitivity and specificity is if you just screen the general population, older people, people with some vague symptoms…
6. Against which epitopes are the FLC assay directed?
The FLC epitopes are located between the interface between the light and heavy chains and are “hidden” – when bound to Ig, they will not be detected. Only when these epitopes are “free”, can they be detected, hence free light chains. They are directed at 2 hidden epitopes.
7. Why is the FLC assay polyclonal and not monoclonal?
The biggest decider many times is COST, but lets put that aside for now.
It appears that polyclonal assays are more robust and have higher yields in product during testing and easier to make. They are unfortunately less specific, but this is not the most critical when one wants to measure the FLC broadly, instead of particlularly specific sites.
Epitopes are three dimensional shapes that the antibody binds to. This is determined by the amino acid sequence. One drawback with polyclonal assays is that lot to lot will vary. The difficulty is to maintain consistency in further production and / or distrubution of the antibody – it is not a simple process to ensure consistency.
8. Describe how a monoclonal antibody is made for use in an assay.
Inject a rabbit (or other animal) with the protein of choice. In three weeks, the rabbit will have produced antibodies to the protein. The rabbit is sacrificed (killed) and the spleen harvested. The spleen is ground up and the cells are put in a culture with a certain myeloma cell line. The culture medium contains colchicine that induces the rabbit cells and the myeloma cells to fuse. It also contains HAT medium: hypoxanthine, aminopterin and thymidine. This specific myeloma cell line cannot recycle thymidine in the presence of hypoxanthine.
So in the culture there are now three cell lines.
Firstly, there are the rabbit cells that haven’t fused; these will die because they are not immortal.
Secondly, there is the myeloma cell line, this will also die because of the recycling problem.
Finally, there is a fused cell line that will survive .
Each of these surviving cell lines will produce one Ig against one part of the protein. Now the researchers take the medium and put a tiny amount into a well. The amount is so small that on average each well will contain only one cell; some will of course contain nothing. Then, each well is targeted against the protein and the most promising ones are investigated further. An immortal Ig producing factory directed against one epitope and based on one cell line, a single clone, or as we’d call it a monoclonal, has been produced. Each manufacturer’s produced immunoglobulin is different and may produce better or worse results.
9. The GP, in Robertson, wants some advice on how to proceed. What do you tell him?
A multidisciplinary approach would be best:
Treatment for the lytic bone lesions (after opinion by radiology): bisphosphonate
Assess overall medication and lifestyle to determine overall risk for worsening renal dysfunction (drugs, co-morbidities……always suggest stopping smoking/drinking)
Prevention of thrombotic/infective episodes
Treatment of any further abnormalities should they arise (hypercalcaemia, anaemia etc.)
Specialist referral:
Haematoncologist for treatment of MM: UPE , Bone marrow biopsy
General surgery for gallstone
10. Is there any relevance for the RUQ/gallstone pain in myeloma specifically?
There are some reports where cholecystitis has presented in MM (mets etc), but it is not a separate entity on its own (such as in POEMS), this is simply the real world where elderly patients have more than one pathology.
Excessive amino acids in the Urine
HOSP #
WARD
A1 Paediatric Ward – Grey’s Hospital
CONSULTANT
Prof. George van der Watt
DOB/AGE
27 day old Female neonate
Abnormal Result
Sodium 186mmol/L
Presenting Complaint
The neonate was taken to the Emergency Department due to seizures.
History
Unfortunately the attending clinician at Greys hospital did not have much of the history.
There was no history of diarrhoea according to what she remembered.
Examination
Patient was severely dehydrated clinically.
Later the patient presented with edema, signs and symptoms of nephropathy and biochemical changes in keeping with liver failure.
Laboratory Investigations
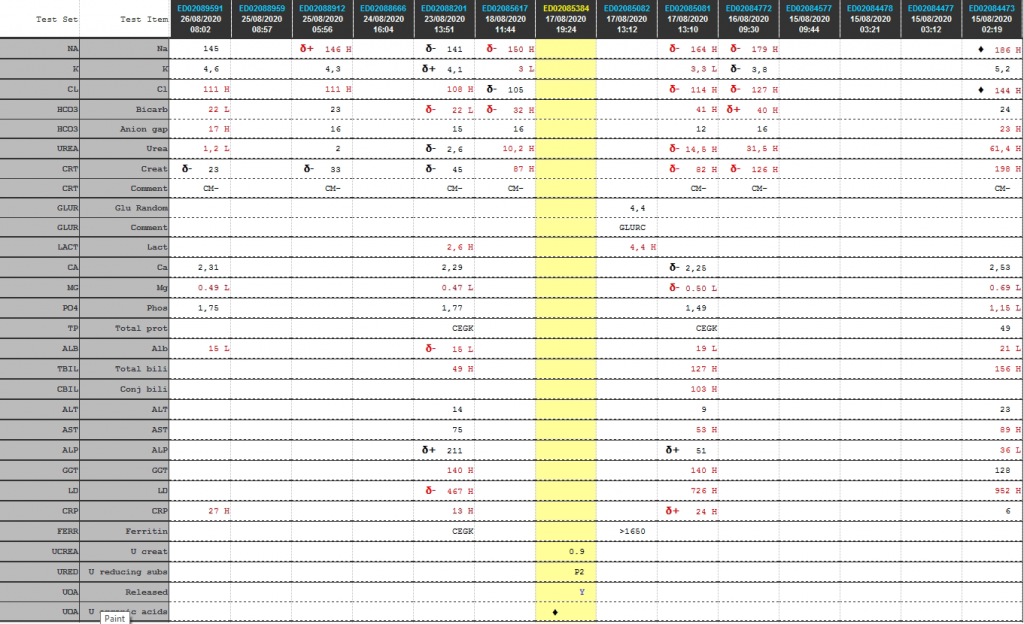
Cumulative laboratory history
Test
26/08/2020
25/08/2020
23/08/2020
18/08/2020
17/08/2020
16/08/2020
15/08/2020
Na
145
δ+ 146 H
δ- 141
δ- 150 H
δ- 164 H
δ- 179 H
♦ 186 H
K
4,6
4,3
δ+ 4,1
3 L
3,3 L
δ- 3,8
5,2
Cl
111 H
111 H
108 H
δ- 105
δ- 114 H
δ- 127 H
♦ 144 H
Bicarb
22 L
23
δ- 22 L
δ- 32 H
41 H
δ+ 40 H
24
Anion gap
17 H
16
15
16
12
16
23 H
Urea
1,2 L
2
δ- 2,6
10,2 H
δ- 14,5 H
31,5 H
61,4 H
Creat
δ- 23
δ- 33
δ- 45
87 H
δ- 82 H
δ- 126 H
198 H
Glu Random
4,4
Lactate
2,6 H
4,4 H
Ca
2,31
2,29
δ- 2,25
2,53
Mg
0.49 L
0.47 L
δ- 0.50 L
0.69 L
Phos
1,75
1,77
1,49
1,15 L
Total prot
CEGK
CEGK
49
Alb
15 L
δ- 15 L
19 L
21 L
Total bili
49 H
127 H
156 H
Conj bili
103 H
ALT
14
9
23
AST
75
53 H
89 H
ALP
δ+ 211
δ+ 51
36 L
GGT
140 H
140 H
128
LD
δ- 467 H
726 H
952 H
CRP
27 H
13 H
δ+ 24 H
6
Ferritin
CEGK
>1650
Table 1. Cumulative laboratory results history from newest to oldest
        Interpretation:
        Urine organic acid analysis by GCMS demonstrates elevation of the liver markers
        4-OH phenyllactate and 4-OH-phenylpyruvate together with lactaturia.
        Succinylacetone, a marker for tyrosinaemia type 1 is absent. These changes
        indicate underlying hepatic dysfunction with lactataemia but are non-specific
        for an IMD per se. Rare forms of lactataemia include defects in pyruvate
        metabolism (gluconeogenic defects such as glycogen storage disease type 1,
        pyruvate dehydrogenase deficiency and thiamine deficiency). In these disorders
        the lactate/pyruvate ratio is normal despite lactataemia. In pyruvate
        dehydrogenase deficiency the CSF/Plasma lactate ratio is typically >2. Please
        note that routine metabolic screening does not exclude galactosaemia. If
        galactosaemia is suspected this should be screened for by measuring red cell
        GALT activity in unspun heparin whole blood or by screening for the common
        African S135L mutation in Black South African patients. As part of our
        gatekeeping policy to limit unnecessary testing, routine metabolic screening at
        Red Cross Children's Hospital consists only of urine organic and amino acid
        analysis. Additional tests must be requested separately based on the working
        differential diagnosis and routine screening results. Relevant legible clinical
        information also aids significantly in interpreting metabolic profiles.
Other Investigations
Urine dipstick: Blood 3+ Protein: Trace Glucose (by glucose oxidase) ++/+++ 28 – 55 mmol/L (hence this is most likely the predominant reducing sugar – as suggested by Prof David). This is an interesting finding since the random glucose in the ward the same day was 4.4 mmol/L. Hence two possible theories: likely either severe tubular injury or, when the child had convulsions they gave a dextrose infusion which increased the plasma glucose above the renal threshold. pH >8.5 Nitrites: Not present Leucocytes: Not present Urobilirubin: Trace Bilirubin: Not present
Final Diagnosis
Severe dehydration with acute kidney injury (pre-renal origin) is the most likely cause of the presentation of seizures.
Take Home Message
Dehydration is a common cause of pre-renal acute kidney injury
My thoughts initially, was that the urine amino acid screening by GCMS demonstrated a heavy generalized aminoaciduria indicative of renal tubulopathy and that cystinosis should be considered as this is the most common inheritable cause of renal tubulopathy in South Africa. However, this was later decided to be changed to rather and “evolving tubulopathy” clinical picture, as shown in the two examples below.
Typical Urine Amino acid profiles of a patient with confirmed cystinuria (left) and a patient with tubulopathy (right)
Fanconi syndrome — Generalized proximal tubular dysfunction, referred to as Fanconi syndrome, is characterized by phosphaturia, renal glucosuria (glucosuria with a normal plasma glucose concentration), aminoaciduria, tubular proteinuria, and proximal RTA.
The etiology of Fanconi syndrome includes inherited diseases or acquired causes [Source: Up-to-date]:
Genetic conditions associated with Fanconi syndrome include the following:
Dent disease (X-linked recessive nephrolithiasis)
Cystinosis
Tyrosinemia type 1
Galactosemia
Wilson disease
Lowe oculocerebrorenal syndrome, also referred to as Lowe syndrome
Hereditary fructose intolerance
Mitochondrial myopathies
Acquired causes of Fanconi syndrome include:
Drugs – Medication associated with Fanconi syndrome include
aminoglycosides
cisplatin
ifosfamide
valproic acid
deferasirox
Heavy metals
lead
mercury
cadmium
The fact that the urine dipstick was positive for glucose, suggests that either the acute kidney injury is the source of glucosuria or the patient was treated with high dose dextrose, causing the plasma glucose to overwhelm the tubular threshold for glucose transport.
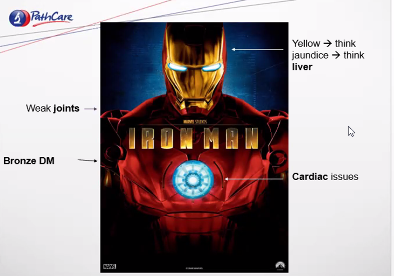
Hemochromatosis
How to remember the side effects of hemochromatosis
Renal tubular acidosis
Two one four, low low more.
A case of raised PSA with ALP
HOSP #
Lab no. SA04016354
WARD
Orthopaedic Clinic
CONSULTANT
Jody Rusch
DOB/AGE
61y Male
Abnormal Result
PSA: 846.5 ug/L
ALP: 284 U/L (53 – 128)
Presenting Complaint
Painful ”lumps” in groin + constipation
Spine pain
History
Smoker (>45 years)
No other co-morbidities
6/12 history of generalized body pain (mostly spine)
Red Flags (weightloss, night pain not responding to analgesia)
Examination
O/E: Pallor (Hb 8.6), Wasted. Clinically painful bilateral inguinal lymph nodes PR: normal tone, no masses, no blood, prostate smooth
Laboratory Investigations
Na
138 mM
K
4,7 mM
Cl
101 mM
Urea
10,3 mM
Creat
69 uM
eGFR by MDRD
>60 ml/min/m2
eGFR by CKDEPI
97 ml/min/m2
Ca
2,26 mmol/L
Mg
1,03 mmol/L
Phos
1,01 mmol/L
Total prot
73 g/L
Alb
37 g/L
Total bili
3 umol/L
Conj bili
2 umol/L
ALT
15 U/L (10-40)
AST
19 U/L (15-40)
ALP
284 U/L (53 – 128)
GGT
76 U/L (<68)
LD
345 U/L
CRP
52 mg/L (<10)
Total PSA
846.5 ug/L (<4)
TSH
1,33 mIU/L (0.27 – 4.2)
Hb
5.6 g/dL
MCV
88.3 fL
WCC
7.57 cells/uL
Table 1 – Blood results on 06/07/2020
Other Investigations
Chest X-Ray: Left hilar opacities
X-ray of the limbs: Global lytic lesions involving both proximal femurs
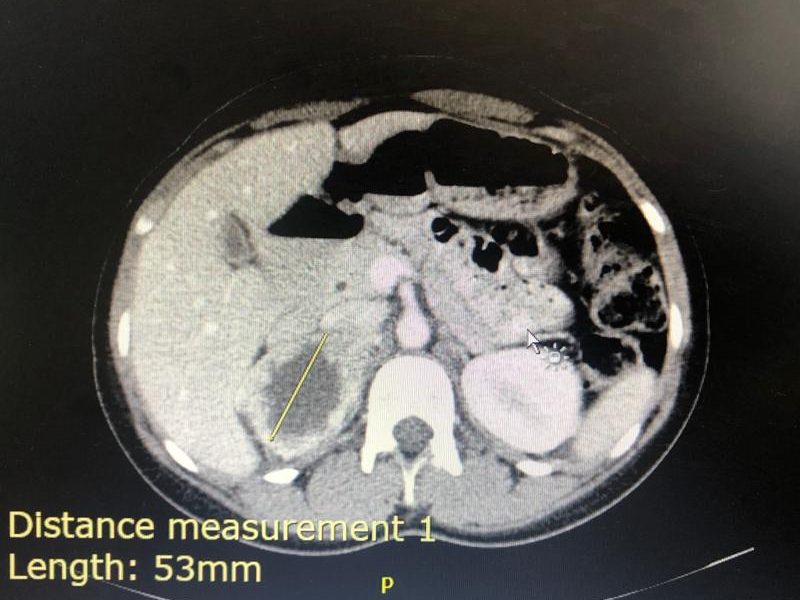
Figure 1 – Lytic lesion seen in the centre of the thoracic vertebral body.Figure 2 – Included for comparison with Figure 1 – not as big lytic lesion seen.Figure 3 – MRI image of the same thoracic vertebral body as shown in Figure 1.Figure 4 – Transverse and coronal views of the CT scan with the outline of the prostate marked in yellow (left middle) and purple lines (right top and bottom)Figure 5 – Small lytic lesions visible in the proximal femur.
Prostate biopsy
MACROSCOPY: Specimen consists of two cores, the longest measuring 12mm in length.
MICROSCOPY Sections show 2 prostatic cores, both infiltrated by a prostatic adenocarcinoma.
Metastatic Prostate Carcinoma with multiple metastases to the bones (thoracic spine and both femurs).
Take Home Message
Prostate-specific antigen (PSA, also known as kallikrein III, seminin, semenogelase, γ-seminoprotein and P-30 antigen) is a 34-kD glycoprotein produced almost exclusively by the prostate gland. It is a serine protease enzyme.
Most PSA in the blood is bound to serum proteins. A small amount is not protein-bound and is called ‘free PSA’. In men with prostate cancer, the ratio of free (unbound) PSA to total PSA is decreased. The risk of cancer increases if the free to total ratio is less than 25%.
The lower the ratio is, the greater the probability of prostate cancer. Measuring the ratio of free to total PSA appears to be particularly promising for eliminating unnecessary biopsies in men with PSA levels between 4 and 10 mg/L.
ALP (alkaline phosphatase) is well known to be a marker of ductal hepatic damage. ALP, being an isozyme, however has its origin from various tissue sources in the body. It is present in the liver, bile duct, kidney, bone, intestinal mucosa and placenta. The majority of ALP in serum is from either skeletal or liver origin. In adults the major form is from liver and in children the major form is from the skeleton.
Blood levels of alkaline phosphatase increase by two to four times during pregnancy. This is a result of additional alkaline phosphatase produced by the placenta.
If it is unclear why alkaline phosphatase is elevated, isoenzyme studies using electrophoresis can confirm the source of the ALP. It would likely in this patient be quite clear that the raised ALP would be due to the excess leakage from the osteolitic lesions from the metastases, but who knows, the patient may have had a beer or five in the preceding 3 weeks leading up to the bloods being drawn. The fact that the other liver enzymes are near-normal, makes alcohol consumption less likely though.
A case of severe hypoalbuminaemia
HOSP #
Lab no: SA03948371
WARD
Paediatric Ward
CONSULTANT
Dr. Jody Rusch
DOB/AGE
16 y Female
Abnormal Result
Albumin of 8 g/L
Presenting Complaint
Signs and symptoms of a urinary tract infection made the patient present to a general practitioner.
History
No known chronic medical illness were present upon initial presentation.
No medical treatment was being taken for chronic illnesses.
The patient had reported taking NSAIDS before for pain in the lower abdomen. The exact drug / dose was unknown.
Examination
All clinical findings are unfortunately not available for this patient.
It is known that the patient had been having lower abdominal pains upon presentation (which was not due to pregnancy).
A urinary tract infection was suspected by the initial treating physician. Upon the other finding of edema, investigation towards the cause was investigated.
Typical findings of nephritic syndrome are:
Fever
Edema (due to hypoproteinemia)
High blood pressure (due to activation of the renin-angiotensis-aldosterone system).
Joint pain
Muscle pain
Malar rash
Foamy urine (proteinuria)
Laboratory Investigations
Albumin 14 g/L
Cholesterol 8.14 mmol/L
Urine Protein:Creatinine ratio: 1.62 g/mmol creat
C3: 0.29 (Low)
C4: 0.07 (Low)
Creatinine 255 – 322 umol/L
Other Investigations
Final Diagnosis
Lupus Nephritis with hypoalbuminemia
Take Home Message
The clinical presentation of this patient is a good example of the findings in patients who initially present with renal failure. The extent of renal failure is often so severe, that when the patient presents with signs and symptoms of renal failure, there are quite significant permanent renal damage already.
Patients with nephrotic syndrome present with significant proteinuria with resultant hypoproteinemia, firstly hypoalbuminemia, followed by the other bigger proteins like gammaglobulins, alpha-1, beta-1 and beta-2 (complement) proteins. Because alpha-2 (macroglobulin) comprises one of the biggest proteins (in molecular size) in the serum, it generally stays in the serum relatively longer than the other leaking proteins.
Because the liver increases its production of proteins to try compensate for the reduction in osmolality, the production of VLDL rises significantly and hence Triglycerides (and cholesterol) rises. Thus cholesterol in this patient measured 8.14 mmol/L.
The pathophysiology of lupus nephritis is that of autoimmunity. Autoantibodies direct themselves against nuclear elements. The characteristics of nephritogenic autoantibodies are antigen specificity directed at the nucleosome. High affinity autoantibodies form intravascular immune complexes, and autoantibodies of certain isotypes activate complement. Hence the C3 and C4 which are low often indicates active lupus disease.
Section 7.7 – Laboratory Management
Presentations attended related to laboratory management:
PathCape 2018
Accreditation, Quality and Leadership – Prof A Zemlin – PathCape 17 August 2018
Error Free Lab Work: Is it an achievable target? – Prof Yenice (Turkey) – PathCape 17 August 2018
P4P (pay for performance) in Laboratory Medicine – Dr Orth (Germany) – PathCape 17 August 2018
Laboratory management course – University of Stellenbosch 02-05 November 2020
The laboratory management course which I attended through Stellenbosch University was an exciting experience. Although during COVID times, it wasn’t necessarily a trip to Stellenbosch where one could have a glas of wine at a local wine farm afterwards, but nonetheless it was an amazing experience. I have made friends with colleagues in other Pathology disciplines remotely and we needed to prepare a Strategic Business Plan and present it at the end of the course.
All talks attended were focussed on laboratory management. The skills learnt during this course will likely still bring much joy and productivity into my work life in future and the tools learnt to properly manage a laboratory are of enormous value.
There were tasks from as simple as a left-right quizz, to a QC workshop for our chemical pathology registrars with Levy-Jennings chart interpretation and the lot. Some of the most enjoyable topics for me were: Adding value to lab medicine, a topic often focussed on by Prof Annie Zemlin, effective laboratory leadership, focussed on by Prof Rajiv Erasmus, an effective laboratory leader in Chemical Pathology and the topic on Risk management by Prof Preiser. Together these topics which were presented (see below) made up an astounding course which brought together a few aspects rarely covered by other lecturers or even reading material elsewhere. This is what makes this course a must for future laboratory leaders.
Day 1 – 02 November 2020 Talk 1 – Leadership Skills For Effective Laboratory Management – Mandela’s Lessons – Prof RT Erasmus Talk 2 – Laboratory Organization – Best Practice – Dr Z Chapanduka Talk 3 – Ethical Leadership – Prof RT Erasmus Talk 4 – Strategy And Leadership Strategic And Goal Planning For Effective Laboratory Management – Prof RT Erasmus Talk 5 – Budget And Introduction Of New Tests – Prof AE Zemlin Talk 6 – Laboratory Safety – Prof TS Pillay
Day2 – 03 November 2020 Talk 1 – Leading And Managing Change In The Laboratory – Prof G van Zyl Talk 2 – Leadership And Diversity – Prof AE Zemlin Talk 3 – Preventing And Managing Conflict In The Laboratory – Prof Schneider Talk 4 – Risk Management In The Diagnostic Laboratory – Prof W Preiser Talk 5 – POPIA For The Healthcare Professional – Dr C Swanepoel Talk 6 – EBLM and Audit – Dr T Jalavu
Day3 – 04 November 2020 Talk 1 – Use Of Quality Management Tools To Assess And Improve Quality – Prof A Whitelaw Talk 2 – Iso 15189 And Preparing The Lab For Accreditation – Prof AE Zemlin Talk 3 – Non-Conformances & Document Control – Dr AA Khine Talk 4.1 – Lean Management And Quality – Dr AA Khine Talk 4.2 – Six Sigma Approach To Quality – Dr AA Khine Talk 5 – Managing A POCT Service – Prof A Whitelaw Talk 6 – Method Validation – Dr M Hoffmann Talk 7 – Extra-Analytical Errors – Dr E Kruger
Day4 – 05 November 2020 Talk 1 – Harmonization, Standardization And Traceability – Dr T Jalavu Talk 2 – Electronic Gatekeeping – Dr H Vreede Talk 3 – Medico-legal aspects of laboratory practice and maintenance of the chain of evidence – Prof J Dempers Talk 4 – Autoverification – Dr H Vreede Talk 5 – Demand Management – Prof AE Zemlin Talk 6 – Uncertainty Of Measurement – Dr E Kruger
Checklist for portfolio assessment
Checklist for Portfolio Assessor
Is the portfolio well-organised and indexed? Does it correspond with all the headings and sections?
Has a research protocol been included?
What research projects has the candidate been involved in? Are these of the expected level and scope for the discipline?
Has the candidate provided evidence of journal club presentations and attendance with adequate reflective learning comments appended?
Laboratory training: has the candidate provided evidence of training in laboratory techniques and methods with evidence of reflective learning a. Has the candidate provided a written technical report of methods in the laboratory? b. Do these reports reflect a good understanding of laboratory techniques?
Management training: a. Is there evidence of management training by attendance at seminars, workshops and courses with accompanying reflective comments.
Case studies: Has the candidate complied with the requirements for short and long case reports? Has the candidate provided the required number of short and long cases with indepth analysis for each? Has the candidate provided the following for the long cases (3000-3500 words): Understanding the theory of the case Clinical assessment of the case Proposed additional investigations or comment on appropriateness of the investigations performed Laboratory issues that could influence the work-up Overall summary of the case Presentation in the portfolio, including a literature review with references in a form appropriate to a journal article.
Seminars and lectures delivered by the candidate: has the candidate provided evidence of lectures and seminars by providing copies of presentations?
Has the candidate performed any laboratory audits?
What outputs has the candidate provided (audits, papers, SOPs) At least one audit (3000-3500 words excluding references) 1000-1500 word description of the MMed project if not completed or attach reprint of paper or submitted manuscript
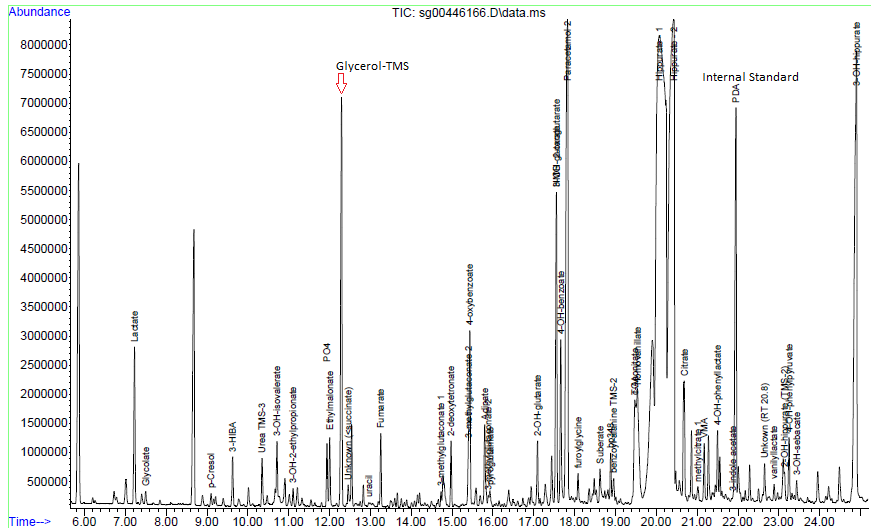
Glycerol which is significantly raised on urine organic acid analysis.
Figure 1 – Chromatogram. The high levels of Glycerol (with TMS – trimethyl silyl derivative) which is >0.5 the peak height of the internal standard (PCA – pentadecanoic acid).Figure 2 – Mass spectrum of the peak as indicated by Glycerol TMS above in Figure 1.Figure 3 – Follow up gas chromatogram without KY-jellyFigure 4 – Mass spectrum in the peak marked as “Glycerol-TMS” from figure 3.
Presenting Complaint
Patient is a 3 month old male with signs and symptoms of sepsis.
History
Patient presented with significant failure to thrive.
Laboratory Investigations
Triglycerides : 4.47 mmol/L
Other Investigations
Faecal elastase 81 ug/g stool
Reference range (adults and children > 1 month):
> 200 ug elastase/g stool: Normal exocrine pancreatic function
100-200 ug elastase/g stool: Moderate/mild pancreatic insufficiency
< 100 ug elastase/g stool: Severe exocrine pancreatic insufficiency
These ranges apply to formed stool samples. Watery stool samples may yield spuriously low elastase results due to dilution, and a formed stool sample should be sent for re-analysis.
Final Diagnosis
Glycerol contamination of the skin – as excluded by the repeat analysis.
Take Home Message
Glycerol (glycerine) is a common contaminant of urine organic acids due to being present in various skin products / creams. Contamination can be eliminated by thorough cleaning of the perineum with normal saline or doing an “in-out” catheterization procedure for urine collection in neonates. Interestingly glycerol is also one of the main ingredients in KY jelly, a common lubricant use for catheterization.
High glycerol in serum will present with a falsely high triglyceride level on most routine chemistry analysers due to the inherent enzymatic conversion of triglycerides to glycerol before further steps to measurement.
Figure 3 – Explanation of triglyceride determination by amperometric detection.
Sepsis is more common than inherited metabolic diseases and so is pre-analytical caveats such as glycerol contamination of the perineal skin.
Hyperaldosteronism with Hyperreninaemia in a 15 year old
The aldosterone:renin ratio (ARR) is a screening test for primary hyperaldosteronism and is most sensitive when both an absolute aldosterone > 350 pmol/L and an ARR > 118 pmol/ng is present.
Na: 138 mmol/L
K: 4.5 mmol/L
Urea 3.7 mmol/L
Creatinine: 49 umol/L
Total Calcium: 2.55 mmol/L
Urine dipstick 1+ protein
The urine protein:creatinine ratio was 0.044 g/mmol creat
Presenting Complaint
Patient presented with a 2 week history of blurry vision, intermittent headaches, hot flushes and mild intermittent epistaxis.
History
No known comorbidities
Multiple episodes of otitis media as a child
Presented with hypertension and evidence of target organ damage (retinopathy and left ventricular hypertrophy).
Funduscopy: Silver wiring, hard exudates, no haemorrhages, no papiloedema
CVS: bounding, peripherals pulses present. JVP raised, Undisplaced apex. Regular HR, no Radial/ femoral delays. Normal S1 & S2 with flowmurmur grade 2.
GIT: soft, non-tender. Ballotable left kidney, non-tender
Resp: Central Trachea, clear viscular breath sounds, no added sounds.
Neurological Exam: GCS 15/15, normal higher functions, no focal neurological signs.
BP control achieved with Doxazocin (increased to 4mg dly) and Atenolol (increased to 50mg dly)
Laboratory Investigations
TestItem
Value
Units
Reference Range
Urine collection period
24
hours
Urine volume
1280
mL
Urine metanephrine
350
nmol/L
Urine normetanephrine
16350
nmol/L
dU metanephrine
448
nmol/24 hrs
167 – 938
dU normetanephrine
20928 (High)
nmol/24 hrs
311 – 1562
Urine metanephrine : creat ratio
159 (High)
nmol/mmol creat
17 – 88
Urine normetanephrine : creat ratio
7432 (High)
nmol/mmol creat
23 – 176
Table 1 – Urine metanephrines (fractionated)
Other Investigations
ECG: Biatrial enlargement, left ventricular hypertrophy
Chest X-ray: Normal Cardio-thoracic index
Cardiac Ultrasound: Concentric left ventricular hypertrophy with preserved left ventricular ejection fraction. No valvular pathology.
KUB ultrasound: Similar kidney sizes. A mass with a cystic center was noted with no evidence of metastatic disease. Diagnosis suggested to be most likely a pheochromocytoma.
Final Diagnosis
Right-sided phaeochromocytoma
Take Home Message
Aldosterone : Renin ratio cannot be looked at alone. A raised value in either of the Aldosterone and Renin should be investigated further, especially if severely deranged like in this case.
Always investigate hypertension in a child until the cause is found. Hypertension in a child is not normal.
3 consecutive 24 hour urine collection samples are recommended for diagnosis of phaeochromocytoma as some tumours only secrete epinephrines / norepinephrines episodically. In this case however it was not necessary as the case was clear with a markedly raised dU-normetanephrine level.
Screening for pheochromocytoma is an essential part of the workup for secondary hypertension. Urinary vanillyl mandelic acid (VMA) was traditionally used to diagnose phaeochromocytoma. It has a low sensitivity (60-70%). Later, catecholamines measurement in plasma (PCAT) and urine (UCAT) emerged as useful tests. The sensitivity of catecholamines is limited by their episodic release from the tumour cells. The sensitivity ranges from 76-86 % for PCAT and UCAT and the specificity is around 81-99 %.
Metanephrines are methylated metabolites of catecholamines.
Metanephrines are secreted continuously from the tumour cells, independent of the intermittent release of catecholamines. The metanephrines are metabolized by conjugation, primarily in the hepatomesentric organs. Plasma metanephrines (pMN) are measured in the free form (not routinely offered in South Africa) whereas urinary metanephrines (uMN) represent mainly the conjugated form. Hence compared to pMN, uMN is less specific. Studies have shown that plasma free metanephrines have a sensitivity of 96-100 per cent and specificity of 85-100 % superior to that of uMN which has a sensitivity of 93-99.6 per cent and specificity of 71-77 per cent.
Previous methods used colorimetry or spectrophotometry as total MET (metanephrine + normetanephrines) which includes a combined measurement of metanephrine (MN) and normetanephrine (NMN). These methods were superseded by liquid chromatographic assays (LC) that allow individual measurement of MN and NMN.
At Red Cross Hospital Laboratory we use a gas chromatography with mass spectrometry, which is not so widely used for fractionated metanephrines. An isotope dilution method is employed, bringing the method up to internationally recognized standards and the quality assurance of the method at the Red Cross Chemistry lab performs well on the international EQA scheme used.
A case of gas
HOSP #
WARD
CONSULTANT
John Stanfliet / Heleen Vreede
DOB/AGE
52 y Female
Abnormal Result
Oral lactose tolerance test:
Time
Fasting
15’
30’
45’
60’
90’
Blood glucose (mmol/L)
4.3
4.3
4.2
4.5
4.4
4.6
Presenting Complaint
Patient presented with bloating and abdominal pains.
History
The medical history is not known
Patient reported symptoms of bloating and abdominal pains. Upon further questioning it became known that she had been troubles by these symptoms especially severe after consuming dairy products.
Examination
Not known.
Signs and symptoms often associated with this condition are:
Abdominal pain and bloating
Gass / flatulence
Diarrhoea
Constipation
Laboratory Investigations
Time
Fasting
15’
30’
45’
60’
90’
Blood glucose (mmol/L)
4.3
4.3
4.2
4.5
4.4
4.6
Other Investigations
No other investigations were done.
Final Diagnosis
Patient appears to be lactose intolerant since we expect a rise of >1.7 mmol/L in glucose when lactose is adequately digested and absorbed after a lactose load of 50g.
The following cut-offs are frequently used:
Glucose rise > 1.7 mmol/L at any of the time points is a normal lactase response
Glucose rise of 1.1-1.7 is equivocal
Glucose increases < 1.1 is consistent with lactase deficiency
Take Home Message
Lactose consists of Glucose and Galactose.
The biochemical handling of oral lactose
The disaccharide cannot be absorbed and needs to be cleaved before absorbtion by the enterocyte. This happens by lactase, normaly present on the distal part of the brush border of the enterocyte. These enterocytes can become damaged by enteritis and loose activity of lactase partially. Lactase activity also decreases with age, hence elderly do develop partial lactose intolerance. The transporter that carries glucose and galactose into the enterocyte is the sodium-dependent hexose transporter, SGLT-1. As the name indicates, this molecule transports both glucose and sodium ion into the cell and in fact, will not transport either alone.
SGLT1 shouldn’t be confused with a GLUT.
Inhibition of SGLT1 delays and reduces glucose absorption in the small intestine, thus improving post meal glycemic control. This is beneficial particularly in patients with declining renal function where SGLT2 inhibition is less effective.
SGLT2 is the major transport protein and promotes reabsorption of glucose from the glomerular filtration back into circulation and is responsible for approximately 90% of the kidney’s glucose reabsorption.
SGLT2 inhibitors, also called gliflozins, are a class of medications that alter essential physiology of the nephron; unlike SGLT1 inhibitors that modulate Sodium/Glucose channels in the intestinal mucosa.
Figure 1 – Picture illustrating a hexose binding to an SGLT protein
How does lactose intolerance normally present?
Bloating and abdominal cramps after dairy ingestion. (Bacteria metabolise disaccharides and produce H2, hence don’t light your farts when lactose intolerant.) It is less pronounced with dairy which has a lot of lactobacilli (live cultures) in it since they can partially digest some of the lactose. Thus cheese and joghurt doesn’t give such severe Sx as the raw milk products.Good. For your own education, think about sour milk
What is the difference between lactose intolerance, milk allergy and galactosaemia?
Lactose intolerance is explained above, and can be either primary (defective enzyme) or secondary due to another condition as is the case in enteritis where the enterocytes are regenerating and temporarily expressing less enzyme on the apical brush border.
Milk allergy is an abnormal response by the immune system to milk and products containing milk. It’s one of the most common food allergies in children. Cow’s milk is the usual cause of milk allergy, but milk from sheep, goats, buffalo and other mammals also can cause a reaction. The allergy is most likely to one of the exogenous proteins in animal origin milk. Milk allergy presents like any other allergy with hives and/or urticaria.
Galactosemia is the inability to metabolise galactose to glucose for metabolism.
3 genes can contain a mutation (GALT, GALK1, and GALE) coding for: