Hyponatremia with a urine sodium measurement

HOSP # WARD Khayelitsha Hospital Emergency Unit
CONSULTANT   Dr. Heleen Vreede DOB/AGE 64y female

Abnormal Result

Serum Sodium of 124 mmol/L

Presenting Complaint

A 64 year old female, presented to the Emergency unit at Khayelitsha Hospital with worsening hyponatremia.

History

The patient had a prior cholecystectomy 6 weeks ago. Histology thereon has shown chronic cholelithiasis but it was complicated with a polyp in the galbladder and adenocarcinoma thereof (completely excised during the cholecystectomy).

Examination

Not available

Laboratory Investigations

Date 24/01/2021 23/01/2021 22/01/2021 11/01/2021 22/12/2020 04/12/2020 19/01/2016
Na        δ-  124 L   129 L   133 L   138     137         
Urea          3,9     3,1     6,1     6,1     8,2 H       
Creat           61   δ-   66      88      73      86      48 L
U Na •   31                                            
U K • 14,9                                            

Other Investigations

Liver enzymes were normal at the last measurement (23 January), inflammatory markers normal, COVID-PCR negative on 11/01/2021.

Unfortunately neither the volume status, serum nor urine osmolarity was available on this patient’s history.

Final Diagnosis

Urinary sodium loss in one form or another. The appropriate response in hyponatremia is to decrease urinary sodium loss. In this patient, the urinary sodium was 31 (should ideally be <20 mmol/L in hyponatremia).

Unfortunately only the urinary sample was sent to our laboratory and it wasn’t possible to assess serum osmolarity.

The volume status was also not available, which is one of the necessities to adequately interpret hyponatremia OR hypernatremia.

Take Home Message

Salt never goes without water – similarly Sodium shouldn’t be interpreted without the volume status of the patient, and the serum (or urine if applicable) osmolarity.

In hyponatremia one expects the kidneys to respond adequately and hold back sodium, hence decreasing urinary sodium (to <20 mmol/L).

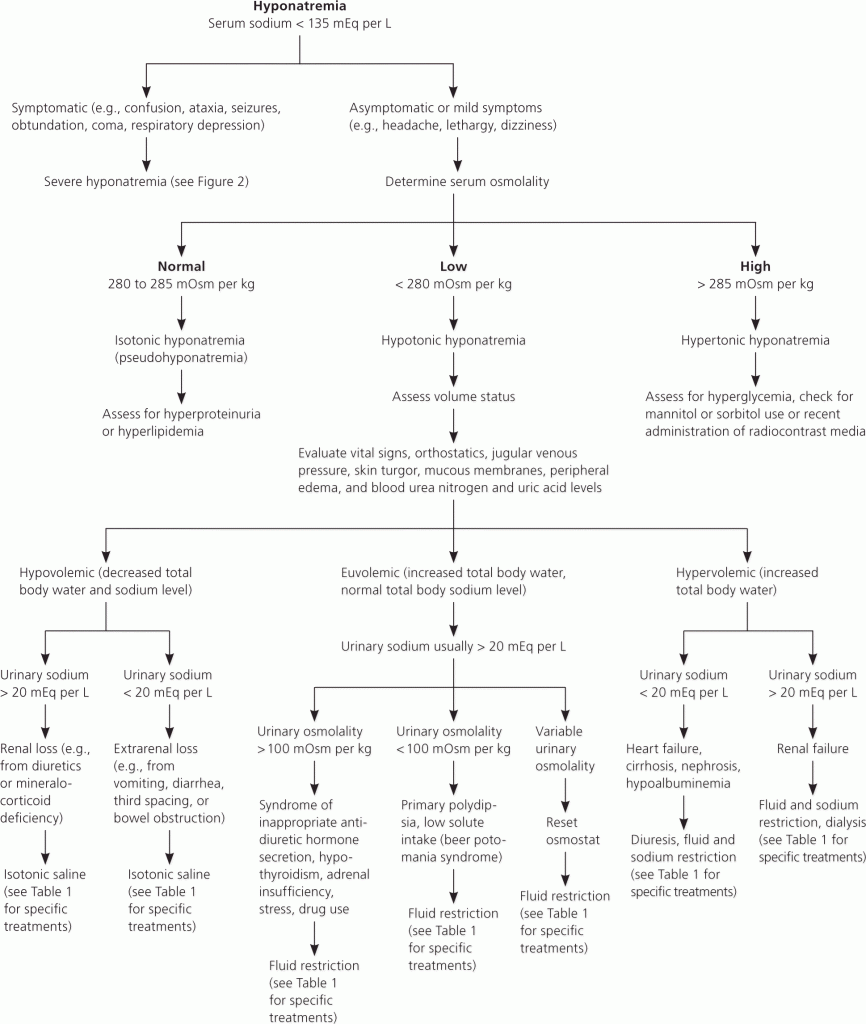
Assuming the patient’s osmolarity was low (by estimation formula) the following possibilities ensue:

Patient Hypervolemic: the high urine sodium points toward renal failure.

Patient Hypovolemic: Renal loss (diuretics / mineralocorticoid deficiency)

Patient Euvolemic: Urine osmolarity should be measured:

Urine Osmol >100: SIADH; Hypothyroidism; Hypoadrenalism (although urine Na usually >30); Stress ; Drug use.

Urine Osmol <100: Primary polydipsia / Beer Potomania syndrome

Variable urinary osmolarity: Needs a “reset” of the osmostat by fluid restriction.

Furthermore: Indicators of renal insufficiency in this patient is the increased creatinine above the patient’s baseline of 48 uM. The creatinine has risen to 88 uM on one occasion. Although not above the reference interval for women, this value constitutes a (88-48)/48 = 83% increase in the creatinine and likely will indicate Acute Kidney injury, probably one of the most overlooked causes of morbidity in hospitalised patients in my opinion.


Beta-HCG’s half life

HOSP # WARD Labour Ward
CONSULTANT   Dr. Jody Rusch DOB/AGE 23 y Female

Abnormal Result

The beta-HCG measured 1.3 million IU/L initially, then decreased significantly after an induced abortion.

Presenting Complaint

A 23 year old lady, at 36 weeks gestation presented with signs and symptoms of Hyperthyroidism. She also had a “retained placenta with hydatid mole” quoted from the request form

History

The patient presented with a gradual onset of hyperthyroidism signs and symptoms during the pregnancy.

Examination

Retained products of conception. This was subsequently removed and sent for histology (see below).

Laboratory Investigations

Episode SA02847149 SA02854036 SA02854698 SA02863861
Date 14/03/2019 17/03/2019 18/03/2019 20/03/2019
Time 13:03 00:47 01:12 15:37
Beta-HCG 1 319 797 203 195 81 165 21 567 

Other Investigations

Histology

MACROSCOPY:
Specimen consists of a large amount of placental tissue fragments with grape-like structures noted, the largest measuring 14mm in diameter. The largest fragment of tissue measures 155 x 50 x 35mm. The entire specimen weighs 374g.

MICROSCOPY:
Sections of placental tissue demonstrate heterogeneity in villous size with large, hypertrophic villi and small fibrotic villi identified. The enlarged villi are irregularly shaped with scalloped borders, and cistern formation. Circumferential mild trophoblastic hyperplasia is noted in some of the villi. Foci of micro-infarction are noted. Overall features are consistent with a partial hydatidiform mole.

PATHOLOGICAL DIAGNOSIS:
Retained products of conception (placenta), biopsy:

Final Diagnosis

  • Gestational trophoblastic disease, consistent with a partial hydatidiform mole
  • Hyperthyroidism likely due to the similarity of the alpha subunit in HCG to the alpha-subunit of TSH, hence stimulating the TSH receptors.

Take Home Message

Graph illustrating the decrease in the B-HCG values on subsequent days after initial measurement on the day the products of conception was removed by dilatation and curettage (day 0).

According to the only source I could find during a quick literature search, I came upon the phrase:

Plasma beta-HCG concentration falls according to a multi-exponential curve with a half-life of 0.63 days in the first 2 days following induced abortion, and of 3.85 days in the subsequent 14 days

van der lugt et al – Disappearance of HCG after induced abortion, 1985

Considering the above, I endeavoured on the task of calculating the half life of the HCG between the 4 time points using Prof Pillay’s method:

F=0.5^(t/T), where F=fraction left, t=time difference and T=half life (units to be kept constant for t and T).

An important log-transformation rule to remember in this case is the logarithm power rule:

Logarithm power rule logb(x y) = y ∙ logb(x)

Thus to calculate the half life between two time points (after rearranging formula above):

T= (t * log(0.5)) / log(F)

Hence

Between days 0 and 2.5:

T = (2.5 * log(0.5))/ log(203 195/ 1 319 797)

  • T (or half life) = 0.92 days

Similarly between days:

  • 2.5 and 3.5: T= 0.76 days
  • 3.5 and 6.15: T = 1.39 days

This corresponds fairly to the quoted 0.63 days which increases on subsequent days after abortion.

The discrepancy could likely be explained due to:

  • some degree of high dose hook effect at the high HCG concentrations,
  • high coefficient of variation at high immunoassay analyte concentrations with assays using a sigmoidal calibration curve,
  • variation in the methods of abortion compared to or
  • gestational age upon which abortion is done, to name a few.

Nonetheless the above equation from Prof Tahir Pillay is useful to calculate half life.

It is important to screen for hyperthyroidism in patients with hydatid moles and ensure that the TFT’s return to normal when the HCG returns to normal.


A serum albumin of 2 g/L

HOSP # WARD Victoria Hospital – Internal Medicine
CONSULTANT Jody Rusch   DOB/AGE 30 y/o Female

Abnormal Result

Albumin = 2 g/L

Previous Albumin results: 5 g/L; 11 g/L; 8 g/L all 3 months apart respectively.

Presenting Complaint

The patient did not present with any complaints and the bloods taken was for follow-up only.

History

Patient is known with HIV, diagnosed in 2019 with a CD4 count of 250 cells/uL at the time.

ANA, ANCA, Hepatitis B negative

C3 & C4 normal

The patient presented previously with a left renal vein thrombosis, kidney sizes 150mm and 149mm respectively.

Examination

Not available.

Laboratory Investigations

Current CD4 count= 140 cells/uL.

Urine protein:creatinine ratio of 0.42 (multiple previous values of >1.5 though)

Total Cholesterol 4.2 mmol/L

Other Investigations

Histology

MACROSCOPY:
Specimen consists of a single pale core measuring 6mm in length.

MICROSCOPY:
Glomeruli:
There are a total of 9 glomeruli present. There are no globally sclerosed glomeruli and there are no crescents present. Focal segmental lesions are present. Neutrophils are frequently identified within capillary loops (endocapillary hypercellularity). There is mild focal segmental increase in mesangial cellularity. Glomerular basement membranes appear mildly increased in thickness in areas. There are no features of collapsing FSGS. Podocytes appear prominent. Focal areas suspicious for early spike formation are noted on Jones silver stain.

Tubules:
Tubules show protein resorption droplets with focal areas of ATI. Areas of tubular atrophy and thyroidisation are present. Tubular microcysts are not a feature.

Interstitium:
Moderate lymphoplasmacytic inflammation is present.

Vessels:
Vessels appear normal.

IMMUNOHISTOCHEMISTRY:
IgA: Negative
IgG: membrane staining presnet
IgM: membrane staining present
C3: Negative
C4d: Negative
C1q: 3+ staining present, membrane and mesangial

ELECTRON MICROSCOPY:
Pending – specimen will be processed ex-wax.

PATHOLOGICAL DIAGNOSIS:
Kidney, biopsy:

  • Immune complex glomerulonephritis with features suggestive of early membranous nephropathy. DDx=HIVICK. TEM pending.
  • Additional acute endocapillary hypercellularity (neutrophils).
  • Moderate chronic interstitial inflammation.

Electron microscopy

Ultra-thin resin sections show the presence of electron dense deposits with subepithelial and intramembranous location in keeping with membranous nephropathy.

Ehrenreich-Churg stage: 1-2

Immunohistochemistry:
IgG4: negative.

PATHOLOGICAL DIAGNOSIS:

  • Features in keeping with membranous nephropathy.

Final Diagnosis

Membranous Nephropathy

Take Home Message

Severe hypoalbuminemia can occur in nephrotic syndrome. One should ascertain before authorizing such a severely deranged result, that it is not due to a sample type swop of kinds. The history of previously low albumin results was in this case confirmatory. The other features of nephrotic syndrome should also be sought, which is hypertriglyceridemia (no triglyceride value was available in this patient but the Total cholesterol was 4.2 mmol/L).

HIVICK (HIV immune complex disease of the kidney) continues to be an important cause of nephropathy in HIV-naive patients in South Africa. In contrast to HIVAN where the HIV infects the podocytes primarily, HIVICK boasts itself in the fact that it indirectly causes disease by initiating an immune response.

This approach utilizes a completely different offensive strategy that eliminates the need to directly infect the kidney one cell at a time as is the case in HIVAN.

HIVICK is an immune complex attack on the kidney that leads to a variety of histopathologic glomerular lesions: membranous, diffuse/membranoproliferative, IgA nephropathy. The unique aspect of these immune complexes is their composition involving specific HIV antigens as the source target of the antibody response. Therefore the development of HIVICK is completely dependent on the presence of active HIV viremia.

This is a very interesting read on the two diseases: https://www.medscape.com/viewarticle/840389_3


A case of elevated caeruloplasmin

HOSP # WARD Pathcare private laboratory
CONSULTANT   John Stanfliet / Jody Rusch DOB/AGE 16 y Male

Abnormal Result

Caeruloplasmin 63 mg/dL (15-37 mg/dL)

Presenting Complaint

Not known. Unfortunately no clinical information is known and only a single result is available.

Final Diagnosis

Probably a benign raised caeruloplasmin

Take Home Message

This case, sent through by Dr. John Stanfliet (Pathcare) prompted thorough read-up on caeruloplasmin:

What is the function of caeruloplasmin?

Caeruloplasmin is an alpha-2 glycoprotein that stores and transports copper in the blood. It is produced primarily by the liver. It is to copper what ferritin is to iron. The primary physiological role of caeruloplasmin, however, is acting as a catalyst for reduction and oxidation (redox) reactions.

How is it measured?

Caeruloplasmin is usually measured by immunoturbidimetry or immunonephelometry.

Other methods employed are: oxidation of o-dianisidine (ODA) or that of the traditional reductant, p-phenylenediamine (PPD).

What causes a low caeruloplasmin?

Primary deficiency is rare.

Secondary deficiency is more common and causes include 

(1) dietary copper insufficiency (including malabsorption),

(2) inability to transport Cu2+ from the GI epithelium into the circulation (as in Menkes disease), or

(3) defective incorporation of Cu2+ into the developing caeruloplasmin molecule (as in Wilson disease)

What are causes of an elevated caeruloplasmin?

Concentrations are increased significantly by estrogens (e.g. pregnancy or with the use of oral contraceptives).

It is also a positive acute phase protein thus increased in inflammation. High levels can be seen in active liver disease and in young children where levels can be 50% higher.

High levels is apparently also present in those with lymphoma and rheumatoid arthritis.

Other interesting facts

The normal levels of ceruloplasmin in serum are more or less 10x lower than that of transferrin in molar and mass units.

Caeruloplasmin reference ranges in mass and molar units (in grey)


Hypercalcemia with uric acid crystals

From other results it is also evident that:

HOSP # WARD Nephritic clinic
CONSULTANT   Dr. Heleen Vreede DOB/AGE 49 y Female

Uric acid nephropathy with hypercalcaemia (Mrs. Linda Meyer) MRN78959694

Abnormal Result

The calcium on 20/02/2019 on bloods taken 14h45 was 3.29 (2.15-2.50 mmol/L).

Presenting Complaint

The patient presented with pain “from loin to groin” which is the typical presentation of passing a renal stone.

History

The patient has chronic renal failure (first creatinine was 362 umol/L with eGFR of 12ml/min – MDRD) on 12 December 2017. Creatinines relatively unchanged since then.

Upon re-evaluation of the case in 2020 it was seen that the baseline creatinine has risen to ~445 umol/L indicating a worsening of the chronic renal failure eGFR now 9 ml/min – by both CKD-EPI and MDRD formulas.

Examination

N/A

Laboratory Investigations

The patient is known with Hyperuricemia, first result 0.50 (0.16-0.36mmol/L) on 16 February 2018.  The response to treatment appears poor due to continuing rising serum uric acid levels (considering whether the patient is on allopurinol).

2. Regarding the hypercalcemia:

Episode SA04315821 SA03552076 SA03535628 SA02816641 SA02784405 SA02622825 SA02369770 SA02123812 SA01901592
Date 11/11/2020 11/12/2019 04/12/2019 04/03/2019 20/02/2019 12/12/2018 04/09/2018 23/05/2018 16/02/2018
Time 09:44 10:22 17:03 15:48 17:44 17:11 10:31 16:25 15:28
Na                 135 L          139     138   139.000   138.000   137.000  
K   5,3 H   4,7     4,8            4,8     4,5   4.320   4.400   4.780  
Urea                17,2 H         14,3 H  16,2 H  11,3 H  18,8 H  17,1 H
Creat   443 H   484 H   434 H   444 H   446 H   475 H   334 H   408 H   415 H
MDRD     9       8       9       9       9       8      13      10      10  
CKD-EPI     9                                                          
Ca  2,79 H         2,59 H  3,09 H  3,29 H  2,97 H 2.820 H 2.850 H  3,12 H
Mg                0.94           1,05    1.00          1.060 H  .980  
Phos                1,02           1,25    1,33    .980   1.240   1.110  
PTH                13,3 H          4,3     4,6                       
Cumulative history of UEC and CMP with PTH.

From above results a consistent hypercalcemia with a single raised PTH result can be seen – see “Final Diagnosis” and “Take Home Message” below.

Other Investigations

Uric acid crystals were seen on the urine microscopy reflecting uric acid nephropathy – a possible cause of the chronic renal failure, but I could not find any biopsy result or alternative explanation for the renal failure and assume it is uric acid nephropathy.  The patient also appears to have been for a procedure at Urology (? Renal stone removal).

A serum protein electrophoresis with immunofixation (13/09/2018) showed no monoclonal peaks.

Final Diagnosis

Uric acid nephropathy with renal stones.

Hypercalcemia likely due to tertiary hyperparathyroidism.

Take Home Message

Uric acid nephropathy appears to be an uncommon cause of chronic kidney disease (ref. Up-to-date).

It should however be emphesized that clinicians consider the cause on a differential, as it is a manageable cause.

Hypercalcemia sometimes occur in Chronic Kidney Disease patients due to tertiary hyperparathyroidism. This is due to persistent hyperphosphatemia with resulting hyperparathyroidism leading to hypercalcemia (as opposed to the more commonly occuring hypocalcemia is renal failure).

——Commentary by Nephrologist- Dr. Erika Jones——

WRT the Uric Acid

Difficult to say if it is cause or effect of CKD. We can only really make a diagnosis of uric acid nephropathy on kidney biopsy. But it is definitely a cause that we see on occasion.

The good news is that the creatinine has remained fairly stable in the last couple of years, unlike the UA, but as kidney function deteriorates it is expected the UA will increase.

According to our buff records she had staghorn calculi and that was labelled as the cause of her CKD.

Allopurinol in CKD is challenging as it accumulates with side effects. We have had two patients with full on Steven’s Johnson Syndrome. So if she isn’t symptomatic I wouldn’t give it to her. She is recorded as having Sarcoidosis which explains the hypercalcaemia. I think this stage is too early to have tertiary hyperparathyroidism.