This was a case discussed in consultation with a private consultant:
The patient was admitted with SARS-CoV-2.
History
The clinician was contacted regarding an extremely low LDL-cholesterol, not comparable with the other measurements.
Medication history was unknown at the time when these results became known and had to be authorized.
Examination
Not applicable and information not available.
Laboratory Investigations
Test
Result
Lipaemia
Absent
Total Cholesterol
< 0.5 mmol/L
Triglyceride
0.38 mmol/L
HDL Cholesterol
1.9 mmol/L
Non-HDL-Cholesterol
-1.40 mmol/L
Cholesterol:HDL ratio
0.3
LDL-cholesterol (calculated)
Not done
LDL-cholesterol (measured)
3.0 mmol/L
Glucose (fasting)
5.0 mmol/L
Other Investigations
From the results above it becomes clear that there are some discrepancies in the results. The total cholesterol, as measured on the Abbott Allinity (<0.5 mmol/L) does not compare against the measured LDL-cholesterol (3.0 mmol/L), which should be lower than the total cholesterol.
Other investigations to perform on this sample would perhaps be to run it on a different analyser.
Final Diagnosis
The clinician was phoned and it was found that the patient was on high doses of Vitamin C intravenously.
Take Home Message
When there’s a big discrepancy between LDL (measured – directly with a homogenous assay) and the total cholesterol, the cause should be determined, or at least investigated.
The Total cholesterol, LDL-cholesterol, Triglycerides and HDL-cholesterol all use Trinder reactions.
Vitamin C is a quencher in the reaction (likely due to its high anti-oxidant activity). Since COVID has been around, there are quite a lot of protocols of treatment with Vitamin C IV. It is likely that patients infused with IV N-acetylcysteine, also a potent anti-oxidant, will also cause spuriously low total cholesterol. Or perhaps spuriously low results in any reaction employing the trinder reaction.
It is also clear from this case how important it is to discuss results which do not make sense with clinicians.
Summary of the Trinder reaction
A few decades ago, Emerson presented a new color test reaction (Emerson 1943), which is still in common use for the determination of phenolic compounds (e.g. Ettinger et al. 1951; Fiamegos et al. 2002). Later, Trinder adapted this reaction for the determination of blood glucose using horseradish peroxidase (HRP), coupling the hydrogen peroxide produced from the glucose oxidase reaction, to the Emerson indicator reaction (Trinder 1969; Barham & Trinder 1972). For this reason, this reaction is also known as the Trinder reaction. The so-called Emerson–Trinder reaction, is now routinely used as a spectrophotometric indicator reaction in clinical chemistry, in which a quinoneimine dye product is produced by oxidative condensation of a phenol with 4-aminoantipyrine (4-AAP) (Emerson 1943). This indicator reaction was subsequently used for the spectrophotometric assay of a large number of substrates or enzymes (Burtis & Ashwood 1994) such as uric acid (Kabasakalian et al. 1973), cholesterol (Allain et al. 1974), free hemoglobin (Bauer 1981) or triglycerides (Fossati & Prencipe 1982) and also by using different organic hydrogen-donor compounds such as different substituted (ortho, meta and para) chloro or bromophenols, 4-hydroxybenzene-sulfonic acid (Wang et al. 1992), 2,4-dichlorophenol (Klose et al. 1978), 3,5-dichloro-2-hydroxybenzensulfonic acid (Fossati & Prencipe 1982; Fossati et al. 1980) or different aniline derivatives (Tamaoku et al. 1982).
Farzad Deyhimi, Massoud Arabieh & Lida Parvin (2006) Optimization of the Emerson–Trinder enzymatic reaction by response surface methodology, Biocatalysis and Biotransformation, 24:4, 263-271, DOI: 10.1080/10242420600661943
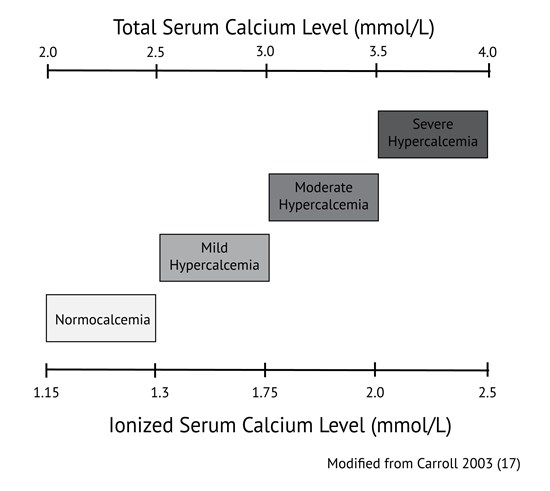
Calcium levels are commonly ordered in both primary and acute care in patients with a variety of signs and symptoms. Hypocalcemia (total calcium concentrations generally below 2.0 mmol/L or ionized calcium below 1.15 mmol/l) is usually related to dietary deficiencies or disorders of the parathyroid axis, such as in patients with previous surgery or autoimmune destruction of the parathyroid gland. Hypercalcemia (above 2.5 mmol/L total calcium or 1.3 mmol/L ionized) in primary care is commonly associated with dehydration, primary hyperparathyroidism, and malignancy such as multiple myeloma. When hypercalcemia is severe, generally defined as total calcium above 3.5 mmol/L or ionized calcium above 2.0 mmol/L, therapy should be initiated immediately. Values of calcium below this threshold but above 3.0 mmol/L total calcium or 1.75 mmol/L ionized are considered moderate hypercalcemia and patients with calcium values in this range may not need immediate therapy but should be monitored closely. Precise values of normal ranges and cut offs may vary between laboratories.
It remains common practice to apply the Payne formula (usually expressed as albumin-adjusted calcium (mmol/L) = total calcium (mmol/L) + 0.02 [40 – albumin (g/L)]) (1) to adjust total calcium. This correction is intended to enhance the ability of the total calcium concentration to serve as a marker of the physiologically relevant parameter, ionized calcium, in patients with hypoalbuminemia.
Since the original Payne paper, clinical use of this correction formula has spread such that many clinicians routinely apply this ‘correction’ to all total calcium measurements. This observation is supported by data available from Vancouver Coastal Health and Providence Health Care laboratories. In 2018, total serum calcium and albumin were ordered together 72% of the time, suggesting that many clinicians believe that serum albumin measurement is required in order to interpret total calcium concentrations.
There are a number of problems with the Payne formula. This formula was derived in 200 patients whom Payne considered to be unlikely to have abnormalities of ionized calcium, however 20% of the patients had hyperproteinemia secondary to multiple myeloma. Payne et al relied upon results from a single laboratory which used methodologies for the measurement of albumin and total calcium which are different from methods in routine use today. The formula was designed to transform the calcium results in those patients who had hypoalbuminemia so that the distribution of results would match the distribution of calcium results in the patients with normal serum albumin concentrations. There was no validation of the formula using ionized calcium, which was not measured.
What data addresses this gap
There is considerable evidence (2-12) that application of the Payne formula tends to misclassify the calcium status of patients and performs less well than simply evaluating uncorrected total calcium. Payne himself recently wrote a letter to the editor (13) in which he acknowledged that his original formula is not universally applicable, requiring modification for the specific albumin assay in use by a laboratory, and that any albumin-based adjustment will likely overestimate calcium in patients with renal failure. In renal failure, the albumin concentration is underestimated when uremia induced carbamylation of albumin reduces its detection by the assay (14). Attempts to derive a new formula (10-12) to improve upon the performance of the Payne formula have failed to find a correction which performs significantly better than unadjusted total calcium.
The physiological basis for the albumin adjustment is the theory that when albumin is reduced, the amount of calcium bound to albumin is also reduced, such that the total serum calcium may be low despite a normal ionized calcium concentration. However, this physiologic basis is belied by evidence that in hypoalbuminaemic states, the binding constant between albumin and calcium changes, and more calcium binds to each available gram of albumin (15). Formulae such as the Payne formula which assume a constant relationship between albumin concentration and the fraction of calcium which is bound to albumin are thus expected to overestimate ionized calcium in patients with low albumin. Several studies have borne out this tendency of correction formulae to overestimate ionized calcium.
Steen et al (2) found that in patients with albumin <30 g/L, 75% of patients classified as normocalcemic using the Payne formula in fact had hypocalcemia based on ionized calcium levels. Another study (3) found that adjusted calcium values derived by applying the Payne formula agreed with ionized calcium levels in only 55-65% of patients. In contrast, unadjusted total calcium correctly categorized 70-80% of patients. Agreement between adjusted calcium and ionized calcium was even worse for patients with renal impairment (eGFR<60 min/mL/1.73m2). The adjustment significantly overestimated calcium concentrations in these patients. A similar trend has been documented in critically ill patients in both the medical and surgical ICU settings (4-6).
The poor performance of the calcium correction has also been observed in the hypoalbuminemic geriatric population (7). Again, the correction impairs the sensitivity of the corrected result to detect true hypocalcemia. The more severe the hypoalbuminemia, the poorer the performance of the adjustment formula. This has also been demonstrated in stable hemodialysis patients (8-9).
Other studies (10-11) have sought to derive new formulae for the purpose of correcting calcium for albumin concentration. James et al (10) considered many possible formulae but ultimately concluded that if any adjustment is to be made to calcium to account for hypoalbuminemia, the adjustment formula must be locally derived.
Many of the studies above were done in hospital inpatients. Less data is available in outpatients, as ionized calcium is more difficult to measure in this population due to the requirement that specimens for ionized calcium be analyzed promptly after collection (16). However, a study which examined results from both inpatients and outpatients of a hospital and excluded critically ill patients (12) confirmed that unadjusted total calcium performs better than any of the available correction formulae (including those put forth by Payne and James) in ROC analysis compared to the ionized calcium gold standard.
What I recommend (practice tips)
Formulae to adjust total calcium for the albumin concentration should be abandoned. The use of these formulae overestimates ionized calcium in patients with hypoalbuminemia, causing false negatives for hypocalcemia and false positives for hypercalcemia. Measurement of ionized calcium is now relatively inexpensive and is available in most hospitals and many outpatient settings.
Measurement of ionized calcium is recommended over total calcium when calcium homeostasis is in question.
If calcium is ordered as a ‘screening’ test without specific clinical suspicion for a disorder of calcium homeostasis, it is reasonable to assess unadjusted total calcium. If this level is abnormal, confirmation with ionized calcium may be sought prior to further workup or therapy.
Where ionized calcium is not available, total calcium should be assessed without the application of any correction formula.
Order serum albumin only if clinically indicated for reasons other than adjusting total calcium.
References
Payne RB, Little AJ, Williams RB, Milner JP. Interpretation of serum calcium in patient with abnormal serum proteins. Br Med J. 1973;4:643-646. DOI: 10.1136/bmj.4.5893.643. (View)
Steen O, Clase C, Don-Wauchope A. Corrected calcium formula in routine clinical use does not accurately reflect ionized calcium in hospital patients. Canad J Gen Int Med. 2016;11(3):14-21. DOI: 10.22374/cjgim.v11i3.150. (View)
Smith JD, Wilson S, Schneider HG. Misclassification of calcium status based on albumin-adjusted calcium studies in a tertiary hospital setting. Clin Chem. 2018;64(12):1713-1722. DOI: 10.1373/clinchem.2018.291377. (Request with CPSBC or view with UBC)
Slomp J, van der Voort PH, Gerritsen RT, Berk JA, Bakker AJ. Albumin-adjusted calcium is not suitable for diagnosis of hyper- and hypocalcemia in the critically ill. Crit Care Med. 2003;31:1389-1393. DOI: 10.1097/01.CCM.0000063044.55669.3C. (View with CPSBC or UBC)
Dickerson RN, Alexander KH, Minard G, Croce MA, Brown RO. Accuracy of methods to estimate ionized and “corrected” serum calcium concentrations in critically ill multiple trauma patients receiving specialized nutrition support. JPEN J Parenter Enteral Nutr. 2004;28(3):133-141. DOI: 10.1177/0148607104028003133. (Request with CPSBC or view with UBC)
Byrnes MC, Hunyh K, Helmer SD, et al. A comparison of corrected serum calcium levels to ionized calcium levels among critically ill surgical patients. Am J Surg. 2005;189(3):310-314. DOI: 10.1016/j.amjsurg.2004.11.017. (View with CPSBC or UBC)
Sorva A. ‘Correction’ of serum calcium values for albumin biased in geriatric patients. Arch Geron Geri. 1992;15(1):59-69. DOI: 10.1016/0167-4943(92)90040-B. (Request with CPSBC or view with UBC)
Clase CM, Norman GL, Beecroft ML, Churchill DN. Albumin-corrected calcium and ionized calcium in stable haemodialysis patients. Nephrol Dial Transplant. 2000;15:1841-1846. DOI: 10.1093/ndt/15.11.1841. (Request with CPSBC or view with UBC)
Gouri A, Dekaken A. A comparison of corrected serum calcium levels to ionized calcium levels in haemodialysis patients. Ann Biol Clin (Paris). 2012;70:210-212. DOI: 10.1684/abc.2012.0693. (Request with CPSBC or view with UBC)
James MT, Zhang J, Lyon AW, et al. Derivation and internal validation of an equation for albumin-adjusted calcium. BMC Clin Pathol. 2008;8:12. DOI: 10.1186/1472-6890-8-12. (View)
Antonio JM. New predictive equations for serum ionized calcium in hospitalized patients. Med Princ Pract. 2016;25:219-226. DOI: 10.1159/000443145. (View)
Lian IA, Asberg A. Should total calcium be adjusted for albumin? A retrospective observational study of laboratory data from central Norway. BMJ Open. 2018;8:e017703. (View)
Grzych G, Pekar JD, Durand G, Deckmyn B, Maboudou P, Lippi G. Albumin-adjusted calcium and ionized calcium for assessing calcium status in hospitalized patients. Clin Chem. 2019;65(5). DOI: 10.1373/clinchem.2018.300392. (Request with CPSBC or view with UBC)
Kok MB, Tegelaers Fp, van Dam B, van Rijn JL, van Pelt J. Carbamylation of albumin is a cause for discrepancies between albumin assays. Clinica Chimica Acta. 2014;434:6-10. DOI: 10.1016/j.cca.2014.03.035. (View with CPSBC or UBC)
Besarab A, Caro JF. Increased absolute calcium binding to albumin in hypoalbuminaemia. J Clin Pathol. 1981;34:1368-1374. DOI: 10.1136/jcp.34.12.1368. (View)
Glendenning P. It is time to start ordering ionized calcium more frequently: preanalytical factors can be controlled and postanalytical data justify measurement. Ann Clin Biochem. 2013;50:191-193. DOI: 10.1177/0004563213482892. (View with CPSBC or UBC)
Carroll MF, Schade DS. A practical approach to hypercalcemia. Am Fam Physician. 2003;67:1959-1966. (View with CPSBC or UBC)
The patient has been having persistent hypocalcemia despite supplementation with calcium.
History
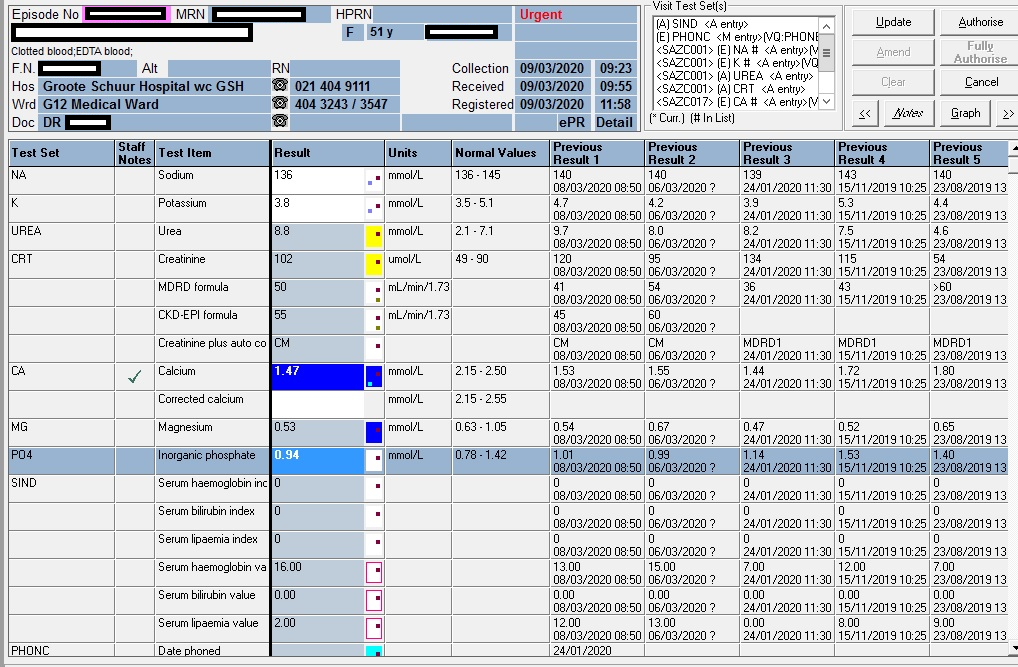
Figure 1 – Illustration of the patient’s CMP over time: Calcium: blue; Magnesium: orange; Phosphate: grey Reference ranges are the horizontal lines without dotted markers
Examination
Not available.
The typical findings in a patient with true hypocalcemia (low ionised calcium) are
Trouseau’s sign
Chvostek’s sign
Laboratory Investigations
Arguably, the first important consideration in patients with low calcium is the albumin. The patient had a mean albumin of 12 g/L, significantly lower than normal (40-50g/L). Arguably, the calcium can be corrected with the well known Payne’s formula to then be 1.47 + (0.02 x (40-12) = 2.03 mmol/L:
Albumin-adjusted calcium (mmol/L) = total calcium (mmol/L) + 0.02 [40 – albumin (g/L)])
Payne RB, Little AJ, Williams RB, Milner JP. Interpretation of serum calcium in patient with abnormal serum proteins. Br Med J. 1973;4:643-646. DOI: 10.1136/bmj.4.5893.643. (View)
Measurement of serum intact parathyroid hormone (PTH) should be performed in all patients with hypocalcemia; it is the most valuable laboratory test for determining the etiology of hypocalcemia:
2019/11/15
2019/06/28
2018/08/03
PTH (pmol/L)
21,8 H
15,5 H
25,8 H
Reference interval: (1.6-6.9 pmol/L)
Vitamin D
09/09/2020
15/11/2019
03/08/2018
Total Vitamin D (25-OH VitD)
20.5 nmol/L
45.4 nmol/L
23.2 nmol/L
Guidelines for assessment of Vitamin D status: <30 nmol/L <12 ng/mL Deficient 30-50 nmol/L 12-20 ng/mL Insufficient >50 nmol/L >20 ng/mL Sufficient 125-150 nmol/L 50-60 ng/mL Safe upper limit Reference: Revised South African Clinical Guideline for the diagnosis and management of osteoporosis (NOFSA 2017), endorsing the institute of Medicine Dietary Reference intakes for calcium and vitamin D (2010). Note regarding conversion of units: Divide result in nmol/L by 2.496 to convert to ng/mL Multiply result in ng/mL by 2.496 to convert to nmol/L
Other Investigations
Anti-Tissue Transglutaminase antibodies: Negative: repeated 3 months apart, with sufficient IgA levels in the serum): 0.9 & 0.8 U/mL (EliA c/o: 6.9)
Hypocalcemia likely due to malabsorbtion (telangiectasia stated by the clinicians).
Take Home Message
According to International guidelines the following association is expected for patients with Coeliac Disease: Positive for HLA-DQ2 (HLA-DQA1*05, DQB1*02) Positive for HLA-DQ8 (HLA-DQA1*03, DQB1*03:02)
Considering the fact that the albumin was high with an increased PTH, the calcium very likely was physiologically also low (bioactive Ca). The Payne’s formula also failed to correct the calcium to the normal reference range.
Urine amino acid screening by GCMS demonstrates massive elevations of cystine at 1842 nmol/mg creat (Ref<125), lysine at 10827 nmol/mg creat (Ref < 630) and ornithine at 2742 nmol/mg creat (Ref <91). Dibasic aminoaciduria at these levels is only seen in cystinuria. Our methodology does not detect arginine but in this scenario it would be similarly elevated.
Presenting Complaint
The patient, a 16 y female presented with signs and symptoms of an upper urinary tract infection.
History
No history of chronic medical illness, no medication. Generally have been well.
The patient did have a cousin, following up at Red Cross Children’s Hospital for congenital cystinuria.
Examination
Renal angle tenderness was noted. There were also symptoms of pain which radiated down to the inguinal area.
Laboratory Investigations
March 2020
The urine microscopy showed numerous (3+) leucocytes and numerous (3+) epithelial cells but no erythrocytes visible. Culture: <10 000 cfu/ml
April 2020
Urinary cystine stones was observed in the urine upon microscopy with 3+ erythrocytes
April 2020
24h quantitative cystine: massive elevations of cystine at 1842 nmol/mg creat (<125), lysine at 10827 nmol/mg creat (< 630) and ornithine at 2742 nmol/mg creat (<91). Dibasic aminoaciduria at these levels is only seen in cystinuria. Creat MW = 113g/mol = 113 mg/mmol; Daily urine creatinine was 6 mmol/24h, thus 113 x 6 = 678 mg / 24h; hence dU cystine was 1842 nmol x 678 = 1 248 876 nmol / 24h = 1 248 umol/24h. Cystine MW = 121 g/mol = 121 ug/umol hence dU cystine was 121 x 1248 = 151 008 ug/24h = 151 mg/24h
October 2020
A 5.2g brown jagged renal stone was removed, confirmed by Fourier Transform infrared spectroscopy to contain 50% calcium hydrogen phosphate and 50% cystine.
April 2021
dU cystine requested again – results not out yet at time of writing.
April 2021
Crystals in the urine reported to be constituted of uric acid – most likely a laboratory error
Other Investigations
On roentgenological examination, cystine calculi are radiopaque (although not as much) like calcareous calculi, but are more rounded and homogeneous in appearance. They may attain a staghorn size.
Final Diagnosis
Cystinuria – to be genetically confirmed in a case series
Take Home Message
Cystinuria stones develop in patients with homozygous cystinuria. Homozygous cystinuria is characterized by urinary cystine excretion of more than 250 mg/g creatinine.
Aetiology
Cystine is sparingly soluble in urine and it rarely exceeds 1.7mM/liter. Its solubility is greater at higher pH and is enhanced by electrolytes and macromolecules. however, it rarely exceeds 1.7 mM/liter (400 mg/liter). Cystine stones may form when urinary cystine concentration exceeds the solubility of cystine.
Pathophysiology of Cystinuria
Normally, cystine is filtered and almost completely reabsorbed in the proximal nephron, so that less than 20 mg is excreted in urine each day. In cystinuria, the serum concentration and hence the renal filtered load of cystine are reduced. Exaggerated cystine excretion under this circumstance suggests a disturbance in renal handling of cystine. More than one defect can impair tubular reabsorption and back-diffusion of cystine.
Similar defects in transport of other dibasic amino acids are present. However, exaggerated renal excretion of these amino acids and cystine may not be due to a single transport defect. Increasing the filtered load of one of these amino acids does not necessarily augment the excretion of others.
The intestinal transport of dibasic amino acids may also be defective in cystinuria. The disorder has been classified into three types based on varying intestinal transport disturbances for these amino acids. The intestinal transport has been assessed by the in vitro uptake of radiolabeled amino acid by specimens of jejunal mucosa obtained by peroral biopsy and by studies of plasma cystine levels after oral cystine administration. In type I cystinuria, there is no uptake of cystine, lysine, or arginine by jejunal mucosa, and plasma cystine concentration is not elevated after an oral cystine load. Thus there is defective intestinal transport of all three dibasic amino acids. In types II and III, the intestinal transport of dibasic amino acids is disturbed but less severely than in the type I presentation. In type II, some cystine is taken up by jejunal mucosa but at a reduced rate, and oral cystine loading does not increase the plasma cystine level. In type III cystinuria, the uptake of cystine and lysine by jejunal mucosa is variably reduced and the increment in plasma cystine after oral cystine loading is blunted. In the homozygous state, all three types of cystinuria involve excessive renal excretion of all four dibasic amino acids. In the heterozygous state, type I cystinuria is characterized by normal cystine excretion, whereas types II and III have elevated cystine and lysine excretion (although not quite up to the level encountered in the homozygous state), probably because of a prevailing (although reduced) intestinal uptake of these amino acids. Recently, discrete mutations in the dibasic amino acid transporter gene have been found in certain cystinuric patients.
Diagnostic Criteria
The urinary sediment (preferably in fresh first morning void) should be examined for the presence of typical hexagonal cystine crystals. The urine sample should also be screened for “qualitative” cystine by the cyanidenitroprusside test. A positive reaction suggests that cystine excretion exceeds 75 mg/liter. A false-positive test may be encountered in patients with homocystinuria and acetonuria. On roentgenological examination, cystine calculi are radiopaque (although not as much) like calcareous calculi, but are more rounded and homogeneous in appearance. They may attain a staghorn size.
If these studies are suggestive of the presence of cystinuria, urinary cystine excretion should be quantitated. Urinary cystine exceeding 250 mg/g creatinine is usually diagnostic of homozygous cystinuria. Stones passed or removed should be analyzed. The presence of cystine provides a definitive diagnosis of cystinuria.
Treatment of Cystine Nephrolithiasis
A low-methionine diet has often been recommended for the control of cystine nephrolithiasis because methionine is a precursor of cystine. Although such a dietary maneuver may reduce cystine excretion, rigid methionine restriction is impractical. Dietary sodium restriction may also reduce cystine excretion, but this beneficial effect may be neutralized by reduced solubility of cystine resulting from loss of the “solubilizing” action of sodium.
In patients with cystine calculi and moderate cystinuria [1 to 2 mM/day (250 to 500 mg/day)], conservative measures of high fluid intake and alkali administration should be attempted. The aim of fluid therapy is to increase urine volume sufficiently to reduce the cystine concentration below the solubility limit. At least 3 liters of fluid should be provided, including two 8-oz glassfuls with each meal and at bedtime. Patients should be directed to wake up at night to urinate and drink water. Additional fluids should be consumed when excessive sweating or intestinal fluid loss is present. A minimum urine output of 2 liters/day on a consistent basis is attainable by most patients with proper and persistent instruction.
In theory, alkali therapy would enhance cystine solubility by raising urinary pH. However, substantial increases in cystine solubility do not occur until the urinary pH exceeds 7.5. The provision of alkali, no matter how much, rarely raises urinary pH above 7.5. When urinary pH increases above 7.0 with alkali therapy, calcium phosphate nephrolithiasis may be enhanced because of the enhanced urinary supersaturation of hy- droxyapatite in an alkaline environment. Excessive alkali therapy therefore is not indicated.
Thus a modest amount of alkali is recommended to maintain urinary pH in a high normal range (6.5 to 7.0). Potassium citrate has the advantages over sodium citrate that it does not cause hypercalciuria, is less likely to promote development of calcium stones, and does not induce increased cystine excretion.
The object of treatment with penicillamine or tiopronin (α-mercaptopropionylglycine) is to reduce total cystine excretion by complexing cysteine, the monomeric form of cystine. Penicillamine or tiopronin may be added to the conservative treatment program in patients with moderate cystinuria when the conservative treatment is ineffective in controlling stone formation. In patients with severe cystinuria [> 2 mM/day (> 500 mg/day)], in whom conservative management alone is not likely to be effective, penicillamine or tiopronin therapy (together with conservative measures) may be begun.
Penicillamine and tiopronin share with cysteine a free sulfhydryl group. Thus, they undergo thiol-disulfide exchange with cystine to form penicillamine-cysteine or tiopronicysteine disulfide, which is much more soluble than cystine. After oral administration, a sufficient amount of penicillamine or tiopronin can be excreted in urine to complex cysteine and thereby lower cystine excretion. Unfortunately, penicillamine therapy is associated with frequent and sometimes severe side effects,including nephrotic syndrome, dermatitis, and pancytopenia. Tiopronin has biochemical and clinical actions similar to those of penicillamine. However, it has a lower toxicity profile than penicillamine.
High succinate in the urine
HOSP #
WARD
Paediatric OPD
CONSULTANT
Prof. George van der Watt
DOB/AGE
3 months male
Abnormal Result
Figure 1 – Total Ion Chromatogram showing Increased succinate (@12.6 min) in the urine organic acid profile.
Presenting Complaint
3week old female. Sample from Edendale lab. No clinical info. No lab form available.
History
None available. Unfortunately this is often the case with specimens sent to the laboratory, even for something as complicated as an organic acid analysis.
Examination
None available.
Symptoms and signs of a serious disorder (SUCLA2) where succinate would be raised are:
early onset low muscle tone
severe muscular atrophy
scoliosis
movement disorders such as dystonia and hyperkinesia
epilepsy
growth retardation
Laboratory Investigations
Test
Result
Lactate
2,1 mmol/L
TSH
6,92 H mIU/L (0.3-5.88)
Free T4
15,1 pmol/L (11.4-20.9)
Free T3
6,1 pmol/L (2.7 – 7.3)
Other Investigations
None known
Final Diagnosis
Bacterial degradation of urine most likely. Hippurate gets degraded to succinate by bacteria. Since there’s no hippurate present in the urine, this is the most likely explanation for this metabolic picture in the urine.
Take Home Message
Succinate is a metabolite very often seen in urine organic acid analyses.
If one sees very high succinate associated with moderate increase in methylmalonate then SUCLA2 must be excluded – a Leigh-like mitochondrial cytopathy.
Methylmalonate was absent in this child’s urine sample – it also increases in this condition.
Figure 2 – Total ion chromatogram of an unrelated case, showing the usual location of hippurate at 20.6 minutes.
Mutations in the SUCLA2 gene leading to SUCLA2 deficiency result in Leigh’s or a Leigh-like syndrome with onset of severe hypotonia, muscular atrophy, sensorineural hearing impairment, and often death in early childhood – hence it’s an important condideration, albeit not the aetiology in this child.
Another important fact about succinate is that fumarate (another Krebs cycle intermediate) is usually lower than succinate. Some authors have described that a reversed succinate:fumarate ratio (i.e. fumarate higher than succinate) indicates likely mitochondrial cytopathy. This should further be evaluated if no overt cause can be found.
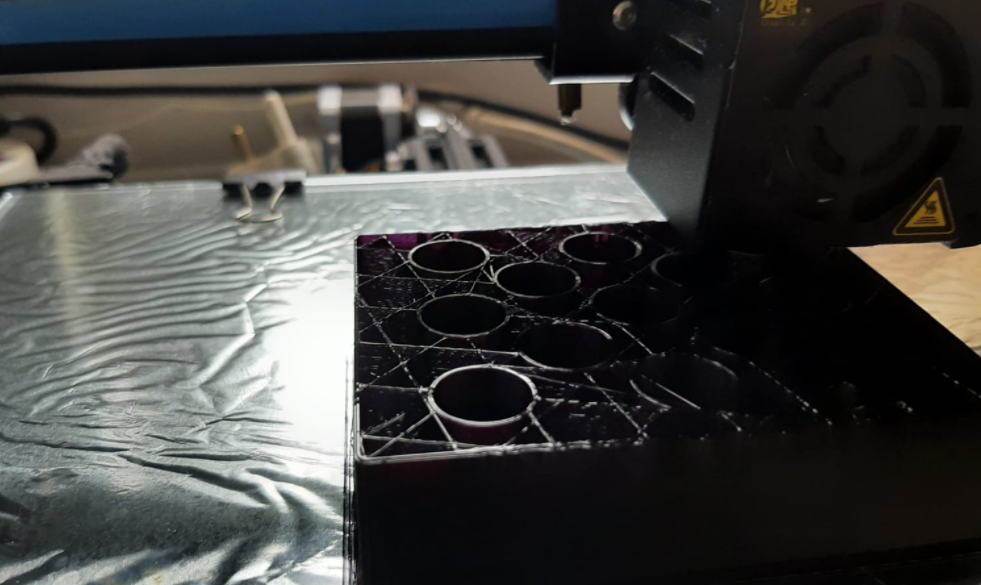
3D Printing in the laboratory
Picture 1 – design of the chip housing case – see scenario below.
Although not strictly a patient case, I will discuss the applicability of 3D printing in the laboratory in two particular problems which presented itself in our laboratory.
Case 1
It so happened that a patient pulled the two electrodes of our iontophoresis machine with a forceful jerk, which caused the thin copper cables inside the insulating holder as shown below (cut open afterwards) to sever. See red and black cables below.
Picture 2 – chip housing after being cut open with a Dremel tool and the accompanying cables after being cut to test the circuits.
A spare cable was fortunately available from Tygerberg Hospital at the time to continue testing patients.
The damage to this cable made the iontophoresis machine unusable. Upon enquiry from the manufacturer, the cable was replaceable but would cost 320 euro (~ZAR5500) and would take weeks to order from Europe. At this bizarre price I reverted to try fix this cable for our laboratory (at least for a spare one should the new one be damaged in the future).
A multimeter was used to test which wires have been damaged and it turned out that 3 of the 4 connecting wires were broken.
Upon removing the thin insulating layers of the wires, the break in the connections were identified and the cables which I had available (recycled from old non-functioning ear phones) were used to solder in place on the connecting electronic chip board. See picture below.
Picture 3 – New wires soldered into place on the connecting chip boardPicture 4 – new wires soldered to electrode contacts and isolated by means of heat shrink piping
The connecting electronic chip, shown above still needed proper isolation, and since I do have a 3D printer at home, I fairly quickly designed a small isolating box in which the chip would fit.
Picture 5 – Design of the Isolating box on Tinkercad – a web based open source 3D design suite.
This was printed with PLA (polylactic acid – a biodegradeable plastic most often used in 3D printing) and the chip was Isolated and the box sealed with a hot glue gun and a soldering iron.
Case 2
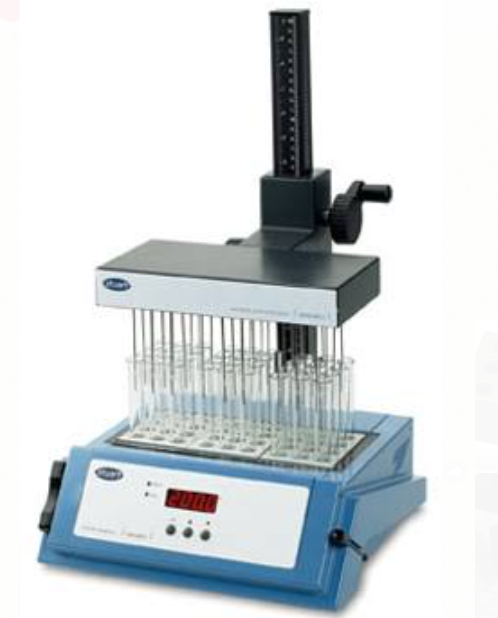
While developing a method for Vitamin A measurement on the HPLC, during sample extraction, a batch of samples need to be dried on the Nitrogen Gas dryer. It so happened that the tubes which we used (high volume tubes) did not fit the current heating blocks used.
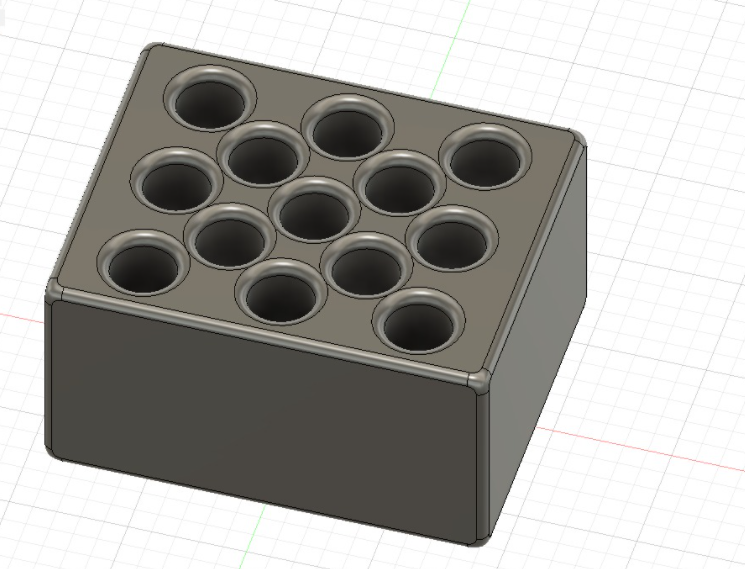
Our scientist requested I print a set of tube holder blocks to fit the holder for the nitrogen drying gas.
The holes in the aluminium heating blocks could also be drilled bigger and deeper to fit the tubes but that would make them unusable for another application with smaller tubes.
See below:
Picture 7 – Example of the Nitrogen drying devicePicture 8 – design of the Tube holders on Fusion360 – more advanced (state of the art) 3D design softwarePicture 9 – Printing the tube holderPicture 10 – printing the tube holderPicture 11 – completed tube holders
Apart from 3D printing a new button for our toasted in the communal kitchen, 3D printing 60-well reaction plates for Tissue Immunology etc, I’m often requested by certain people in the lab to print a certain part which is otherwise unobtainable in a reasonable time / at a reasonable cost.
Hypernatremia with hypokalemia
HOSP #
MRN86510387
WARD
Internal medicine
CONSULTANT
Dr Jody Rusch
DOB/AGE
35 year female
Abnormal Result
Hypernatremia (sodium = 161 mmol/L)
Persistent Hypokalemia (potassium 1.9 mmol/L)
Presenting Complaint
Acute on chronic gastroenteritis
History
35 year old female. Known HIV positive on ARV with weight loss. GIT symptoms. To exclude villous atrophy/parasitic infestation.
This is an HIV positive patient (CD4: 40 cells/uL; viral load: 54 869 copies/mL (4.74 log copies/ml))
The patient has had a CD4 < 150 since 2018.
HIV Viral load has never been suppressed <1000 copies / ml.
There are concerns of ARV compliance
Examination
Not available
Laboratory Investigations
Two days earlier:
Test
Result
Sodium mmol/L
145
Potassium mmol/L
2.0 L
Chloride mmol/L
124 H
Urea mmol/L
7.9 H
Creatinine umol/L
246 H
Other Investigations
Histological examination requested after colonoscopy: Mild erythema of caecum. To exclude TB/CMV
Patient has undergone a colonoscopy as well as an enteroscopy and mild erythema of the caecum was seen.
The terminal ileum showed: intestinal metaplasia with preserved villous architecture. There is no evidence of active inflammation, ulceration or increased intraepithelial lymphocytes seen. There is no evidence of ova, viral inclusions, granulomas or parasites, and no evidence of dysplasia or malignancy present, hence no pathologic diagnosis.
The caecum biopsy, which was macroscopically erythematous, showed fragments of colonic mucosa with areas of crypt branching and focal gland associated neutrophils.
Final Diagnosis
Mild chronic active colitis.
Take Home Message
This patient, who has laboratory findings of AIDS, likely has a combination of aetiologies accounting for the deranged electrolytes. The acquired immune deficiency likely is complicated by repeated infections with accompanying inflammation of the colonic mucosa – this seems to have been ongoing for months already.
This may well likely have been causing dehydration which recently have caused acute kidney injury, with creatinine rising from a baseline of 86, three weeks prior, to ~250 umol/L.
Some simple bedside laboratory tests may be helpful in aetiological evaluation. In cases where diarrhea has persisted for more than two weeks, testing the stool for glucose and pH can be helpful in identifying those patients with severe villous atrophy. This can be done easily at the bedside with a urine dipstick if available. Glucose test tape, nitrazine paper, and Clinitest tablets also have been used. A stool glucose of greater than 2+ or a pH of less than 5.0 suggests substantial villous atrophy.
Bicarbonate HCO3 CO2 CO3
Method
Bicarbonate is the second largest fraction of the anions in plasma. Included in this fraction are the bicarbonate (HCO3–) and carbonate (CO32-) ions, as well as the carbamino compounds. At the physiological pH of blood, the concentration of carbonate is 1/1000 that of bicarbonate. The carbamino compounds are also present in such low quantities that they are generally not mentioned specifically. Several different methods for the determination of bicarbonate in serum and plasma have been reported. Most of these procedures utilize acidification of the sample and conversion of all carbon dioxide forms to CO2 gas. The amount of gas formed is measured by manometric or volumetric devices, ion selective electrodes, or spectrophotometric techniques. These methods are either cumbersome, time-consuming, technique-oriented, and/or require special equipment. Enzymatic procedures using phosphoenolpyruvate carboxylase (PEPC) have been described. The bicarbonate content of serum or plasma is a significant indicator of electrolyte dispersion and anion deficit. Together with pH determination, bicarbonate measurements are used in the diagnosis and treatment of numerous potentially serious disorders associated with acid-base imbalance in the respiratory and metabolic systems.
Test principle
Bicarbonate reacts with phosphoenolpyruvate (PEP) in the presence of PEPC to produce oxaloacetate and phosphate:
PEPC PEP + HCO3– —> oxaloacetate + H2PO4– The above reaction is coupled with one involving the transfer of a hydrogen ion from NADH analog to oxaloacetate using MDH.
MDH
Oxaloacetate + NADH analog + H+ —> malate + NAD+ analog The resultant consumption of NADH analog causes a decrease in absorbance, which is proportional to the concentration of bicarbonate in the sample being assayed.
Raised fecal osmolar gap
HOSP #
MRN123486438
WARD
Victoria Hospital Pediatric Ward
CONSULTANT
Dr Jody Rusch
DOB/AGE
2y male
Abnormal Result
Fecal osmolar gap 152 mmol/L (<100 mmol/L)
Presenting Complaint
The patient presented with chronic diarrhoea upon which fecal chemistry was requested.
History
The full history is not known.
He presented with an increased anion gap metabolic acidosis a week prior to the stool investigations being requested.
The most common explanation thereof is likely two-fold in the acute setting when the child presented:
A fasting response with lipolysis and generation of ketone bodies leading to the acidosis
Dehydration leading to hypoperfusion of tissues with a lactic acidemia
Uremia and the increased creatinine in the child was indicative thereof
Examination
Not available
Laboratory Investigations
Stool chemistry: Faecal sodium 22 mmol/L Faecal potassium 39.4 mmol/L Faecal osmolality 275 mOsm/kg Faecal osmolarity (calculated) 123 mmol/L Faecal osmolar gap 152 mmol/L A faecal osmolar gap (the difference between measured and calculated osmolarity) of > 100 mmol/L suggests the presence of poorly absorbed solutes.
Other Investigations
Stool reducing substances: 1+
If a positive stool reducing substances is found, characterization of the reducing substance follows. In our laboratory, this is done by thin layer chromatography.
Test Item
23/04/2021 (6 days later)
17/04/2021 (Presentation)
Na
138
135 L
K
4,2
4
Cl
106
102
Bicarb
δ+ 20 L
13 L
Anion gap
16
24 H
Urea
δ- 2,2
6,8 H
Creat
25
32 H
CRP
4
Final Diagnosis
Chronic (or persistent) diarrhoea: In this case the stool microscopy also showed species of Cryptosporidium, likely the cause of the prolonged diarrhoea. Also the relative lactase deficiency after episodes of enteritis is common due to the lactase enzyme being primarily located at the apical surface of the microvili of the enterocytes, also the common site of infection of various infective organisms, such as cryptosporidium.
Take Home Message
A faecal osmolar gap (the difference between measured and calculated osmolarity) of >100 mmol/L suggests the presence of poorly absorbed solutes. A “quick and dirty” way of excluding this is by doing a dipstick of fecal fluid. In cases where diarrhea has persisted for more than two weeks, testing the stool for glucose and pH can be helpful in identifying those children with severe villous atrophy. This can be done easily at the bedside with a urine dipstick if available. Glucose test tape, nitrazine paper, and Clinitest tablets also have been used. A stool glucose of greater than 2+ or a pH of less than 5.0 suggests substantial villous atrophy.
A low stool osmotic gap suggests secretory diarrhea, wherein the digestive tract is hyperpermeable and losing electrolytes, while a high gap suggests osmotic diarrhea, wherein the digestive tract is unable to absorb solutes from the chyme, either because the digestive tract is hypopermeable (e.g. inflammation), or non-absorbable compounds (e.g. Epsom Salts, Lactose) are present. The reason for this is that secreted sodium and potassium ions make up a greater percentage of the stool osmolality in secretory diarrhea, whereas in osmotic diarrhea, other molecules such as unabsorbed carbohydrates are more significant contributors to stool osmolality.
Raised fecal calprotectin
HOSP #
WARD
GIT clinic
CONSULTANT
Dr. Heleen Vreede
DOB/AGE
59 y male
Abnormal Result
Faecal calprotectin >6000 ug/g stool
Presenting Complaint
59 y male, presenting with diarrhoea and bloody mucus per rectum
History
This is a 59 year old male known with ulcerative colitis proctitis who now has a suspected flare.
Ulcerative colitis (pancolitis) diagnosed 2009.
Histological history
2017: Mild focal active colitis noted on Histology
2019: Sections of rectal mucosa showed features of active chronic proctitis. The crypts showed distortion with focal areas of crypt abscesses noted. The lamina propria was expanded by reactive polymorphous mature lymphocytes with conspicuous eosinophils.
Examination
Unknown
One would look for especially extra-intestinal manifestations of Ulcerative Colitis
Laboratory Investigations
Histology: Sections of colon demonstrate a severe acute colitis with cryptitis , crypt abscess and numerous neutrophils in the lamina propria on a background of chronic changes illustrated by architectural disarray and glandular atrophy.
Other Investigations
Apart from the colonoscopy and histology, one needs to evaluate for other autoimmune disorders in the gastro-intestinal tract, especially complications of primary sclerosing cholangitis. No biochemical signs thereof was present.
Test (units)
Result
Creat (umol/L)
122 H
MDRD
53
CKD-EPI
56
Alb (g/L)
44
Total bili (umol/L)
4 L
Conj bili (umol/L)
2
ALT (U/L)
18
AST (U/L)
30
ALP (U/L)
77
GGT (U/L)
16
CRP (U/L)
2
Final Diagnosis
Inflammatory Bowel Disease (Ulcerative colitis)
Take Home Message
We have in recent years started to offer this test. One of our recently qualified pathologists, Dr. Justine Cole, was responsible for the method validation of this assay at our laboratory. There were quite a few difficulties with the validation, mainly due to stool being a difficult to work with matrix and sample stability when transported.
In summary:
Faecal calprotectin is excreted in excess into the intestinal lumen during the inflammatory process and so can act as a marker for inflammatory diseases of the lower gastrointestinal tract. Faecal calprotectin testing is recommended in patients with recent onset lower gastrointestinal symptoms, if cancer is NOT suspected, for the differential diagnosis of inflammatory bowel disease (IBD e.g., Chrohn’s disease, ulcerative colitis) or irritable bowel syndrome (IBS).
Faecal calprotectin <=50 ug/g stool is negative, i.e., supports IBS.
Faecal calprotectin >50 ug/g stool is positive, i.e., supports IBD.
Primary amenorrhoea with ulcerative colitis
HOSP #
WARD
CONSULTANT
DOB/AGE
15 y girl
Abnormal Result
This patient was discussed at a combined Endocrinology / Chemical Pathology meeting.
Total bilirubin: 281 umol/L
Presenting Complaint
The patient was a candidate for a liver transplant, but was referred to the endocrinology department for the short stature and primary amenorrhoea prior to surgery.
History
She was diagnosed with ulcerative colitis in 2016 (@ 12y age) and primary sclerosing cholangitis. Breast development started in 2018 (@14 years), but no menstrual cycles started ever since.
She has one younger sister which is well currently at 4 y age.
Birth weight was 3.8 kg.
Medication
Patient was receiving steroids and sulfasalazine intermittently.
For portal hypertension she is also receiving furosemide and spironolactone
Vitamin D supplements are also given
Examination
Height (114cm) for age: <3rd percentile
Weight 35 kg
Breasts well developed – Tanner IV,
No armpit hair growth, parse pubic hair – Tanner II
Laboratory Investigations
Test
Result
Total bili (umol/L)
281 H
Conj bili (umol/L)
246 H
ALT (U/L)
58 H
AST (U/L)
151 H
ALP (U/L)
524 H
GGT (U/L)
65 H
TSH mIU/ml
1,74
Free T4 (pmol/L)
16,4
Free T3 (pmol/L)
2,8 L
FSH (IU/L)
8,2
LH (IU/L)
6,2
E2 (pmol/L
462
Prog (nmol/L)
0.9
Prolactin (ug/L)
15,4
INR
2.09
IGF-1 (ug/L) 107.8 – 541.5 Tanner stages: Boys Girls Stage I 63 – 271 ug/L 71 – 394 ug/L Stage II 114 – 411 ug/L 122 – 508 ug/L Stage III 166 – 510 ug/L 164 – 545 ug/L Stage IV 170 – 456 ug/L 174 – 480 ug/L Stage V 161 – 384 ug/L 169 – 400 ug/L
23.5
Table 1 – Results
Other Investigations
Histology (Colonoscopy)
MICROSCOPIC: Right, transverse and left colon: Sections show large bowel type mucosa with maintained crypt architecture with no cryptitis or crypt abscess formation noted. No significant increased intra epithelial lymphocytes or subepithelial collagen deposition is present. The lamina propria shows normal inflammatory cells with no giant cells, granulomas, infective organisms, viral inclusions, epithelial atypia or malignancy identified. Colon mucosa morphologically within normal limits
Rectum: Sections show large bowel mucosa with preserved crypt architecture and increased chronic inflammation in the lamina propria. Active inflammation is absent. There is no evidence of granulomas, viral inclusions, parasites or dysplasia. Non-specific increase in chronic inflammation in the lamina propria.
The other proposed additional examination is a pubic ultrasound to evaluate the ovaries, fallopian tubes and uterus.
It was also proposed that IGF binding protein 3 be measured, as low levels may yield IGF-1 shorter biologically active.
Final Diagnosis
Primary amenorrhoea most likely due to a physiological delay. Although the pelvic ultrasound hasn’t been done at the time of writing, the low IGF-1 likely indicates a low growth due to chronic systemic disease – see other possible aetiologies below.
Take Home Message
Amenorrhea can be a condition resulting from dysfunction of the hypothalamus, pituitary, ovaries, uterus, or vagina.
The most common aetiologies include:
Gonadal dysgenesis, including Turner syndrome – 43%
Müllerian agenesis (absence of vagina, sometimes with absence of uterus) – 15%
Physiological delay of puberty (constitutional delay of puberty, chronic systemic disease, acute illness) – 14%
Patient presented at 7 years of age with galactorrhea and visual field defects.
History
Patient had a craniotomy for debulking of the adenoma. This was opposed to the usual transsphenoidal more non-invasive route of pituitary adenoma surgery. She was initiated on Cabergoline 1 g twice weekly for suppression of the tumour size.
It was also noted during surgery that the tumour was extremely vascular with much bleeding and the neurosurgeons struggled to mobilize it to adequately get it separated from the optic chiasm. Some portion of the tumour was left in situ during surgery as this was too big a risk for trying to excise.
A biopsy was also taken.
Examination
Patient subsequently developed severe intracranial edema after surgery in the ICU.
Laboratory Investigations
Other Investigations
Histology
Frozen section – pituitary adenoma. GROSS DESCRIPTION: Specimen labelled tumour. Specimen consists of 2 fragments of tissue, larger measuring 4x3mm. HISTOLOGY: Sections show tumour tissue composed of nests of monotonous cells with intervening fibrous septae. The cells have round nuclei and abundant eosinophilic cytoplasm. The nuclei have stippled chromatin with inconspicuous nucleoli. No mitotic activity or necrosis is seen. Immunohistochemistry: Synaptophysin:Positive Prolactin: Positive LH: Negative FSH: Negative GH: Negative TSH: Negative ACTH: Negative CONCLUSION: Pituitary, mass, excision: – Pituitary adenoma with an immunohistochemical profile compatible with a prolactinoma.
Final Diagnosis
Pituitary Macroadenoma
Take Home Message
Cabergoline, sold under the brand name Dostinex among others, is a dopaminergic medication used in the treatment of high prolactin levels, prolactinomas, Parkinson’s disease, and for other indications. It is taken by mouth. Cabergoline is an ergot derivative and a potent dopamine D₂ receptor agonist.
Lactotroph adenomas (prolactinomas) are more amenable to pharmacologic treatment than any other kind of pituitary adenoma because of the availability of dopamine agonists, which usually decrease both the secretion and size of these tumors. For the minority of lactotroph adenomas that do not respond to dopamine agonists, other treatments must be used. Hyperprolactinemia due to nonadenoma causes should also be treated if it causes hypogonadism.
There are two principal reasons why patients with hyperprolactinemia may need to be treated: existing or impending neurologic symptoms due to the large size of a lactotroph adenoma, and hypogonadism or other symptoms due to hyperprolactinemia, such as galactorrhea.
A third indication is in women with mild hyperprolactinemia and normal cycles who are trying to conceive as they may have subtle luteal phase dysfunction.
Bilateral adrenal vein sampling
HOSP #
Mr JB
WARD
Endocrine Department – CathLab – UCT private Hospital
CONSULTANT
Dr Jody Rusch
DOB/AGE
53y Male
Abnormal Result
Upon authorizing blood results I came across a aldosterone result of 23300 pmol/L.
After a moment of brief anxiety, luckily I realized this was part of a series of tests performed by my colleagues in the Department.
Presenting Complaint
Medical complaint: Suspected Conn’s disease – right adrenal lesion/ irregular left adrenal gland.
History
The patient was confirmed to have primary hyperaldosteronism.
Unfortunately more information is not known. We were asked to assist with the sampling and the whole history weren’t available.
Examination
Not available
Laboratory Investigations
Table 1 – Results and calculations done in Excel.
Other Investigations
Not available for this patient.
Ideally one would need a CT with contrast beforehand to adequately visualize the positions of the adrenal veins, as this may aid in the canulation, especially of the right adrenal vein.
One needs to diagnose hyperaldosteronism (by an appropriate salt loading test) before proceeding to bilateral adrenal vein sampling.
Final Diagnosis
Interpretation
Definition
Formula
Clinical significance
Selectivity index
PCC(side) / PCC (ivc)
>cutoff confirms canulation of adrenal vein >3 stimulated >2 unstimulated
Lateralization index
PAC/PCC (dom) : PAC/PCC (non-dom)
>cutoff confirms laterilization of hyperaldo secretion >4 stimulated >2 unstimulated
Contralateral suppression index (used if inadequate canulation)
PAC/PCC (non-dom) : PAC/PCC (ivc)
<cutoff (<1 or <0.5 – sources differ) indicate ipsilateral suppression and suggest contralateral aldosterone overproduction.
These two results indicate that the left adrenal has been canulated adequately, but the right vein inadequately.
Lateralization index
Unable to comment because of the inadequate canulation of the right adrenal vein. If determined, it would very likely provide a false result.
Contralateral suppression index
1.5 : 1.8 = 0.8
This falls in between some of the referenced cutoffs (<1 and <0.5)
All of the other samples also fall somewhere in this range. Biochemically, these results suggests inadequate right sided venous sampling (a commonly described problem)
Take Home Message
Procedure is done in the Cath Lab
The patient received continuous synacthen infusion – as this improves the sensitivity (or perhaps rather specificity) of the test.
Done under imaging with contrast used for the localisation of the adrenal gland and adrenal vein
Sequential sampling technique used, generally > 20 mins infusion
Multi-disciplinary: nurses, anaesthetist, radiographer, intervention radiologists, students, chemical pathologists
Difficulty with sampling right side for both patients
Difficulty with interpreting results – most likely due to inadequate canulation of the right adrenal vein
Some important learning points
Adrenal vein sampling may be a valuable tool that is underutilised
Careful selection of patients essential – also patient should consent to surgical removal of the affected adrenal before this invasive procedure is initiated
Inter-disciplinary approach is necessary
Obtaining cosyntroponin (aka synacthen) can be difficult (Section 21), but recommended.
Right adrenal access difficult: may require specific imaging. Recommended to start on the right or do simulataneous sampling.
Adrenalectomy may be curative or help achieve better control of BP thus decrease associated morbidity and mortality in those with unilateral adenoma
A likely case of thyrotoxic periodic paralysis
HOSP #
WARD
Internal Medicine
CONSULTANT
Dr. Jody Rusch
DOB/AGE
21 y male
Abnormal Result
Potassium of 1.9 mmol/L was found on a blood gas analysis.
Presenting Complaint
Patient presented with a few isolated episodes of muscle weakness. This progressed from 2 weeks before, during the index episode, to become so severe that he couldn’t walk.
History
Patient was given IV potassium + MgSO4 upon which the potassium normalised to 5.5 mmol/L History of muscle weakness was on and off over the last few months – unable to walk for brief periods of time. No Family Hx of illnesses / hypokalmeia No hypertension and no family Hx of hypertension Patient had sweating more than usual. No other overt Sx of hyperthyroidism. No medications
The mother had no similar symptoms ever.
The father was unfortunately not involved and not contactable.
Examination
Normal pulses Small goiter, diffusely enlarger No cardiovascular system abnormalities
Laboratory Investigations
Potassium upon the current consultation: 4.6 mmol/L Normal Sodium, Creatinine, calcium, magnesium, phosphate and chloride
Normal pH 7.35 Normal HC03 Suspecting: Hypokalemic periodic paralysis TSH < 0.01 Free T4: 59 pmol/L Free T3: 21 pmol/L TSH-Receptor Antibodies: Increased above the cut-off
Creatine Kinase 749
Other Investigations
The further investigations needed to confirm the diagnosis
Final Diagnosis
Considering the fact that the patient had no renal tubular acidosis, no medication which could cause the low potassium, it was, according to the endocrinologist, likely a diagnosis of Thyrotoxic Periodic Paralysis (TPP).
Patient was placed on Neomercazole and a Beta-adrenergic receptor blocker.
Take Home Message
I wasn’t aware of the condition until this case was brought up to the endocrinology meeting.
Thyrotoxic periodic paralysis is a rare cause of muscle paralysis.
TPP is a disorder most commonly seen in Asian men, is characterized by abrupt onset of hypokalemia and paralysis. The condition primarily affects the lower extremities and is secondary to thyrotoxicosis.
It has been increasingly reported in the USA due to the rise in the immigrant population. Hypokalemia in TPP results from an intracellular shift of potassium induced by the thyroid hormone sensitization of Na+/K+–ATPase rather than depletion of total body potassium. Treatment of TPP includes prevention of this shift of potassium by using nonselective beta-blockade, correcting the underlying hyperthyroid state, and replacing potassium.
It is important for physicians to distinguish TPP from familial hypokalemic periodic paralysis, a more common cause of periodic paralysis in Caucasians. The absence of a family history of paralysis, male sex, presentation in the second to fourth decades of life, and signs of thyrotoxicosis like sinus tachycardia help in the diagnosis of this disorder. Early recognition of TPP is vital to initiating appropriate treatment and to avoiding the risk of rebound hyperkalemia that may occur if high-dose potassium replacement is given.
It is most common in Asian populations – incidence approximately 2% in patients with thyrotoxicosis of any cause.
It has been recognized in Thais, Filipinos, Vietnamese, Koreans, Malaysians, Hispanics, African Americans, and Caucasians. It is characterized by acute onset of severe hypokalemia and profound proximal muscle weakness in patients with thyrotoxicosis.
Conn’s syndrome with a focus on a unilateral adrenal gland
HOSP #
Mrs DW
WARD
Endocrine Department – CathLab – UCT private Hospital
CONSULTANT
Dr Jody Rusch
DOB/AGE
49y Female
Abnormal Result
49yr old female
Presenting Complaint
Medical complaint: Suspected Conn’s disease – right adrenal lesion/ irregular left adrenal gland
History
Past Medical History: Resistant Hypertension, primary hyperaldosteronism (confirmed previously with saline infusion test), hypokalaemia, hypercholesterolaemia, newly diagnosed DM.
Ideally one would need a CT with contrast beforehand to adequately visualize the positions of the adrenal veins, as this may aid in the canulation, especially of the right adrenal vein.
One needs to diagnose hyperaldosteronism (by an appropriate salt loading test) before proceeding to bilateral adrenal vein sampling.
Final Diagnosis
Interpretation
Definition
Formula
Clinical significance
Selectivity index
PCC(side) / PCC (ivc)
>cutoff confirms canulation of adrenal vein >3 stimulated >2 unstimulated
Lateralization index
PAC/PCC (dom) : PAC/PCC (non-dom)
>cutoff confirms laterilization of hyperaldo secretion >4 stimulated >2 unstimulated
Contralateral suppression index
PAC/PCC (non-dom) : PAC/PCC (ivc)
<cutoff indicate ipsilateral suppression and suggest contralateral aldosterone overproduction.
These two results indicate that the left adrenal has likely been canulated adequately, but the right vein inadequately.
Lateralization index
Unable to comment because of the inadequate canulation of the right adrenal vein. If determined, it would very likely provide a false result.
Contralateral suppression index
616.8 /1260.25 : 2540/3609
= 0.70
This falls in between some of the referenced cutoffs (<1 and <0.5)
All of the other samples also fall somewhere in this range. Biochemically, these results suggests inadequate right sided venous sampling (a commonly described problem)
Take Home Message
Procedure is done in the Cath Lab
The patient received continuous synacthen infusion
Done under imaging with contrast used for the localisation of the adrenal gland and adrenal vein
Sequential sampling technique used, generally > 20 mins infusion
Multi-disciplinary: nurses, anaesthetist, radiographer, intervention radiologists, students, chemical pathologists
Difficulty with sampling right side for both patients
Difficulty with interpreting results – most likely due to inadequate canulation of the right adrenal vein
Some important learning points
Adrenal vein sampling may be a valuable tool that is underutilised
Careful selection of patients essential – also patient should consent to surgical removal of the affected adrenal before this invasive procedure is initiated
Inter-disciplinary approach is necessary
Obtaining cosyntroponin (aka synacthen) can be difficult (Section 21), but recommended
Right adrenal access difficult: may require specific imaging. Recommended to start on the right or do simulataneous sampling
Adrenalectomy may be curative or help achieve better control of BP thus decrease associated morbidity and mortality in those with unilateral adenoma
Amiodarone-induced hyperthyroidism
HOSP #
WARD
Endocrine clinic
CONSULTANT
Jody Rusch / Khalid Aligail
DOB/AGE
21 y female
Abnormal Result
TSH: < 0.01 mIU/L (0.27 – 4.2)
Free-T4: 80.9 pmol/L (12 -22)
Free-T3: 10.8 pmol/L (3.1 – 6.8)
Presenting Complaint
Started to have frequent supra-ventricular arythmias – hence placed on amiodarone by the cardiologists
History
Mitral valve repair in 2018.
Started Warfarin, then later stopped.
Upon routine visit for follow-up 1 w before, the cardiologist requested TFT’s.
Examination
Denies chest pain, shortness of breath and has no symptoms of dyspnoea
No lower limb oedema
No sweating
No abdominal complaints
Patient is comfortable, no distress
CVS unremarkable
Muffled systolic murmur, JVP normal, No lower limb oedema.
Fine tremor, pulse rate 84
No eye signs
Gland diffusely enlarged, and no focal nodules detected
Bruit was clearly audible
Laboratory Investigations
TSH receptor antibodies = 3.3 U/L (<1.8)
Other Investigations
Radio-active Iodine thyroid uptake scan showed no uptake in the thyroid gland – not indicative of Graves Thyrotoxicosis.
Final Diagnosis
Summary: 21 y female, 1 y after mitral valve replacement placed on amiodarone now presented with a diffusely enlarged thyroid gland with a bruit clearly audible and no signs or symptoms of hyperthyroidism, but with biochemical evidence of significant hyperthyroidism
DDx: No symptoms pointing towards overt thyroid problems before initiating, thus this is likely Amiodarone – induced thyrotoxicosis
2 types are known, differentiated by either a diffusely enlarged thyroid which is more likely type 2 than type 1 .
Take Home Message
Rx differs between type 1 and type 2:
High iodine uptake is usually type 1 : usual Rx of Hyperthyroidism is given, thus Lugol’s iodine, else if non-responsive: radio-active Iodine or surgery.
If not much uptake on the uptake scan: Type 2 : points towards destruction of the gland : Rx = steroids
Which is more common?
In a local study of ~250 patients in 10y period it was found the longer it is left, the higher the chance of thyrotoxicosis. “Type 2 is likely more common”- prof Ross.
How does lithium thyroid disease work?
Lithium increases the enterothyroidal iodine recirculation : characteristically causing a : goiter with hypo or hyperthyroidism (thyroiditis).
Lithium inhibits proteases which liberates T3 and T4, hence inhibiting Iodine recirculation.
Interestingly, despite having a free T4 of ~80pmol/L, the patient had no symptoms whatsoever.
Also, of note, amiodarone more often causes hyperthyroidism than hypothyroidism.
A case of amenorrhoea in a 17-year old female
HOSP #
MRN94883340
WARD
Paeds Endocrine Clinic
CONSULTANT
Jody Rusch / Ariane Spitaels
DOB/AGE
17 year female
Abnormal Result
Prolactin 51.1 ug/L
Monomeric Prolactin 36.2 ug/L
Presenting Complaint
Amenorrhoea (more details unknown)
History
The patient presented with a tempoparietal tumour and had received two episodes of radiotherapy – was asked by the oncologists to be reviewed by the Endocrinologists.
Mother stopped epilim (reason unknown)
Patient currently has amenorrhoea (unknown whether it is primary or secondary)
Examination
Residual right hemiplegia
Unfortunately no other facts about the physical examination are known
Laboratory Investigations
Normal TFT:
TSH 1.7 mIU/L (0.51 – 4.3)
Free T4 16.2 (12.6 – 21.0)
Cort 11am 330 nmol/L
FSH 3.8 IU/L
LH 2.4 IU/L
E3 106 pmol/L
Prol 51.1 ug/L
Monomeric Prolactin 36.2 ug/L
Recovery: 70.8%
Other Investigations
Proposed investigations:
Pregnancy test (most common cause of amenorrhoea)
Ovarian ultrasound to exclude early-onset PCOS (which may become a diagnosis of exclusion)
History about prior amenorrhoea
Brain MRI to visualize pathology in the cranium
Final Diagnosis
Hyperprolactinemia – likely causing amenorrhoea – cause yet to be determined
Take Home Message
Hyperprolactinemia is perhaps one of the most common problems in clinical endocrinology. It relates with various aetiologies (see below), the clarification of which requires careful history taking and clinical assessment. Analytical issues (presence of macroprolactin or of the hook effect) need to be taken into account when interpreting the prolactin values. Medications and sellar/parasellar masses (prolactin secreting or acting through “stalk effect”) are the most common causes of pathological hyperprolactinaemia. Hypogonadism and galactorrhoea are well-recognized manifestations of prolactin excess, although its implications on bone health, metabolism and immune system are also expanding. Treatment mainly aims at restoration and maintenance of normal gonadal function/fertility, and prevention of osteoporosis; further specific management strategies depend on the underlying cause.
The main physiological causes of hyperprolactinemia:
Ovulation
Pregnancy
Breastfeeding
Stress
Exercise
Nipple stimulation or chest wall injury
Pathological
Prolactin-secreting pituitary adenoma
“Stalk-effect” from sellar / parasellar lesions
Renal failure
Liver cirrhosis
Primary hypothyroidism
Polycystic Ovarian Syndrome
Seizures
Pharmacological
Antipsychotics / neuroleptics
Antidepressants
Antiemetics
Opioids
Antihypertensives
It is clear in this case that the history is quite important in any patient in whom hyperprolactinemia is detected, since a vast array of causes exist.
The patient, a 5y female presented to the medical emergency departement with status epilepticus, more accurately described as gelastic seizures: laughing for no apparent reason.
These seizures was eventually controlled with multiple anti-convulsants: 2 doses of midazolam, phenobarbital and a loading dose of phenytoin. The seizures have resolved just before the clinicians wanted to initiate Lucrin.
History
No previous medical history of note. This was the first presentation of the child to hospital with disease.
Examination
Unusual findings:
Tanner III breasts – confirmed by an Endocrinologist
Height Taller than +2 z-scores
Bone age 8y
Laboratory Investigations
LH pending (expected to be high)
FSH pending (expected to be high)
E3 pending (expected to be high due to stimulation from above via GnRH)
Other Investigations
CT brain was ordered swiftly, and a hamartoma in the hypothalamic region of the brain was visualized.
Final Diagnosis
Precocious puberty – most likely due to the Tanner III breasts
Hypothalamic hamartoma (HH) – likely the focus of the epileptic episode (gelastic seizure) as well as the cause of the precocious puperty.
Take Home Message
Gelastic seizures is the term used to describe focal or partial seizures with bouts of uncontrolled laughing or giggling. They are often called laughing seizures. The person may look like they are smiling or smirking.
New to me was that HH’s are often associated with producing LH or GnRH itself:
The most common, and usually the only, endocrine disturbance in patients with HH and epilepsy is central precocious puberty (CPP). The mechanism for CPP associated with HH may relate to ectopic generation and pulsatile release of gonadotropin-releasing hormone (GnRH) from the HH, but this remains an unproven hypothesis. Possible regulators of GnRH release that are intrinsic to HH tissue include the following: (1) glial factors (such as transforming growth factor α – TGFα) and (2) γ-aminobutyric acid (GABA)–mediated excitation. Both are known to be present in surgically-resected HH tissue, but are present in patients with and without a history of CPP, suggesting the possibility that symptoms related to HH are directly associated with the region of anatomic attachment of the HH to the hypothalamus, which determines functional network connections, rather than to differences in HH tissue expression or pathophysiology.
Figure 1 – Cellular and molecular mechanisms contributing to GnRH release by normal human hypothalamus. Pulsatile release of GnRH from the GnRH neurons (purple) located in the medial basal hypothalamus is the final common pathway. Excitatory (glutamatergic) and inhibitory (GABAergic) neurons project directly onto the GnRH neuron. At least a subset of GnRH neurons demonstrates paradoxical excitation with GABA input, which is also observed in large HH neurons. Glia-generated influences are also present, with excitation mediated by transforming growth factor α (TGFα) and downstream factors. Kisspeptin-expressing neurons also project directly onto GnRH neurons. HH tissue is universally positive for TGFα but negative for kisspeptin expression. The exact molecular mechanisms responsible for premature pulsatile release of GnRH in association with HH are not understood, but ectopic release from the HH lesion is a viable hypothesis. (From Lomniczi A, Matagne V, Ojeda SR. Neuroendocrinology of puberty. In: Squire LR (Ed). Encyclopedia of Neuroscience. Elsevier, London, 2009. Used with permission.) https://www.ncbi.nlm.nih.gov/pmc/articles/PMC5533614/