The patient presented with a tempoparietal tumour and had received two episodes of radiotherapy – was asked by the oncologists to be reviewed by the Endocrinologists.
Mother stopped epilim (reason unknown)
Patient currently has amenorrhoea (unknown whether it is primary or secondary)
Examination
Residual right hemiplegia
Unfortunately no other facts about the physical examination are known
Laboratory Investigations
Normal TFT:
TSH 1.7 mIU/L (0.51 – 4.3)
Free T4 16.2 (12.6 – 21.0)
Cort 11am 330 nmol/L
FSH 3.8 IU/L
LH 2.4 IU/L
E3 106 pmol/L
Prol 51.1 ug/L
Monomeric Prolactin 36.2 ug/L
Recovery: 70.8%
Other Investigations
Proposed investigations:
Pregnancy test (most common cause of amenorrhoea)
Ovarian ultrasound to exclude early-onset PCOS (which may become a diagnosis of exclusion)
History about prior amenorrhoea
Brain MRI to visualize pathology in the cranium
Final Diagnosis
Hyperprolactinemia – likely causing amenorrhoea – cause yet to be determined
Take Home Message
Hyperprolactinemia is perhaps one of the most common problems in clinical endocrinology. It relates with various aetiologies (see below), the clarification of which requires careful history taking and clinical assessment. Analytical issues (presence of macroprolactin or of the hook effect) need to be taken into account when interpreting the prolactin values. Medications and sellar/parasellar masses (prolactin secreting or acting through “stalk effect”) are the most common causes of pathological hyperprolactinaemia. Hypogonadism and galactorrhoea are well-recognized manifestations of prolactin excess, although its implications on bone health, metabolism and immune system are also expanding. Treatment mainly aims at restoration and maintenance of normal gonadal function/fertility, and prevention of osteoporosis; further specific management strategies depend on the underlying cause.
The main physiological causes of hyperprolactinemia:
Ovulation
Pregnancy
Breastfeeding
Stress
Exercise
Nipple stimulation or chest wall injury
Pathological
Prolactin-secreting pituitary adenoma
“Stalk-effect” from sellar / parasellar lesions
Renal failure
Liver cirrhosis
Primary hypothyroidism
Polycystic Ovarian Syndrome
Seizures
Pharmacological
Antipsychotics / neuroleptics
Antidepressants
Antiemetics
Opioids
Antihypertensives
It is clear in this case that the history is quite important in any patient in whom hyperprolactinemia is detected, since a vast array of causes exist.
The patient, a 5y female presented to the medical emergency departement with status epilepticus, more accurately described as gelastic seizures: laughing for no apparent reason.
These seizures was eventually controlled with multiple anti-convulsants: 2 doses of midazolam, phenobarbital and a loading dose of phenytoin. The seizures have resolved just before the clinicians wanted to initiate Lucrin.
History
No previous medical history of note. This was the first presentation of the child to hospital with disease.
Examination
Unusual findings:
Tanner III breasts – confirmed by an Endocrinologist
Height Taller than +2 z-scores
Bone age 8y
Laboratory Investigations
LH pending (expected to be high)
FSH pending (expected to be high)
E3 pending (expected to be high due to stimulation from above via GnRH)
Other Investigations
CT brain was ordered swiftly, and a hamartoma in the hypothalamic region of the brain was visualized.
Final Diagnosis
Precocious puberty – most likely due to the Tanner III breasts
Hypothalamic hamartoma (HH) – likely the focus of the epileptic episode (gelastic seizure) as well as the cause of the precocious puperty.
Take Home Message
Gelastic seizures is the term used to describe focal or partial seizures with bouts of uncontrolled laughing or giggling. They are often called laughing seizures. The person may look like they are smiling or smirking.
New to me was that HH’s are often associated with producing LH or GnRH itself:
The most common, and usually the only, endocrine disturbance in patients with HH and epilepsy is central precocious puberty (CPP). The mechanism for CPP associated with HH may relate to ectopic generation and pulsatile release of gonadotropin-releasing hormone (GnRH) from the HH, but this remains an unproven hypothesis. Possible regulators of GnRH release that are intrinsic to HH tissue include the following: (1) glial factors (such as transforming growth factor α – TGFα) and (2) γ-aminobutyric acid (GABA)–mediated excitation. Both are known to be present in surgically-resected HH tissue, but are present in patients with and without a history of CPP, suggesting the possibility that symptoms related to HH are directly associated with the region of anatomic attachment of the HH to the hypothalamus, which determines functional network connections, rather than to differences in HH tissue expression or pathophysiology.
Figure 1 – Cellular and molecular mechanisms contributing to GnRH release by normal human hypothalamus. Pulsatile release of GnRH from the GnRH neurons (purple) located in the medial basal hypothalamus is the final common pathway. Excitatory (glutamatergic) and inhibitory (GABAergic) neurons project directly onto the GnRH neuron. At least a subset of GnRH neurons demonstrates paradoxical excitation with GABA input, which is also observed in large HH neurons. Glia-generated influences are also present, with excitation mediated by transforming growth factor α (TGFα) and downstream factors. Kisspeptin-expressing neurons also project directly onto GnRH neurons. HH tissue is universally positive for TGFα but negative for kisspeptin expression. The exact molecular mechanisms responsible for premature pulsatile release of GnRH in association with HH are not understood, but ectopic release from the HH lesion is a viable hypothesis. (From Lomniczi A, Matagne V, Ojeda SR. Neuroendocrinology of puberty. In: Squire LR (Ed). Encyclopedia of Neuroscience. Elsevier, London, 2009. Used with permission.) https://www.ncbi.nlm.nih.gov/pmc/articles/PMC5533614/
A case of high HDL-cholesterol
HOSP #
WARD
GP Clinic
CONSULTANT
John Stanfliet / Jody Rusch
DOB/AGE
73 year Female
Abnormal Result
Abnormal lipid profile (see below)
Presenting Complaint
A 73 year old female was investigated with a full lipid profile after presenting with an increased total cholesterol upon routine screening at her general practitioner.
History
The patient had an increased Total Cholesterol, but was otherwise not unwell. Medication history unfortunately not available.
Examination
Not available
Laboratory Investigations
Test
Result
Urea
7.2 mmol/L
Creatinine
105 umol/L
eGFR
46 ml/min/1.73m2
Fasting Lipid profile (lipemia index -turbidity- on sample was absent):
Total Cholesterol
6.7 mmol/L
Triglyceride
0.6 mmol/L
HDL Cholesterol
> 4.7 mmol/L
Non-HDL Cholesterol (calculated)
< 2.0 mmol/L
LDL Cholesterol (calculated)
< 1.7 mmol/L
LDL Cholesterol (direct – measured)
1.3 mmol/L
Glucose Fasting
5.5 mmol/L
Table 1 – Full lipogram with other routine chemistry tests.
Other Investigations
To rule out the possibility of interferents, the following tests were performed.
Test
Value
Apo A1
4.24 g/L (424 mg/dL) (Ref. >140 mg/dL)
Apo B
0.52 g/L (52 mg/dL) (Ref. < 130 mg/dL)
Apo B : Apo A1 ratio (calculated)
0.12
Table 2 – ApoA1 and ApoB by immunoassay. ApoA1: the major lipoprotein in HDL particles. ApoB: the major lipoprotein in Non-HDL particles.
Final Diagnosis
Increased HDL which may likely be an APOC3 deficiency.
Take Home Message
Although not present in this case, elevated apolipoprotein B (ApoB) confers increased risk of atherosclerotic cardiovascular disease, even in a context of acceptable LDL cholesterol concentrations. Extremely low values of ApoB (<48 mg/dL) are usually related to malabsorption of food lipids and can lead to polyneuropathy. Reduced apolipoprotein A1 (ApoA1) confers an increased risk of coronary artery disease. Extremely low ApoA1 (<20 mg/dL) is suggestive of liver disease or a genetic disorder. Elevated ApoB:ApoA1 ratio confers increased risk of atherosclerotic cardiovascular disease, independently of LDL and HDL cholesterol concentrations.
If the inverse of the above is true, then this lady is likely destined to live forever, but that’s the whole conundrum in lipid metabolism – the inverse of one’s theories does not always hold true under randomized controlled studies, and due to the difficulty of finding a proper control group. It was however previously demonstrated that patients with ApoC3 deficiency (if this is the cause in this case) increases longevity.
APOC3 has been established as an inhibitor for lipoprotein lipase, a gene that hydrolyzes triglycerides to generate free fatty acids before their uptake by muscle and adipose tissue (reviewed in Jong et al). Mice with a high-level expression of human APOC3 on a background of Ldlr deficiency proved to be an excellent model for familial combined hyperlipidemia, because they are disturbed in the breakdown of triglycerides. In contrast, mice lacking Apoc3 show increased activity of LPL, which causes hypotriglyceridemia and protection from postprandial hypertriglyceridemia. From these mice studies, it became clear that a deficiency of APOC3 could cause a healthier lipoprotein profile, which is associated with protection from cardiovascular diseases. However, in the absence of APOC3-deficient subjects, this hypothesis was difficult to test directly.
Dodacki, A., Wortman, M., Saubaméa, B. et al. Expression and function of Abcg4 in the mouse blood-brain barrier: role in restricting the brain entry of amyloid-β peptide. Sci Rep7, 13393 (2017). https://doi.org/10.1038/s41598-017-13750-0
Glucagon Stimulation C-peptide testing
HOSP #
WARD
Endocrinology ward
CONSULTANT
Dr. Heleen Vreede
DOB/AGE
22 y Male
Abnormal Result
Patient presented with Diabetic Ketoacidosis and a glucose value of 27.4 mmol/L.
Presenting Complaint
Signs and symptoms typical of Diabetic Ketoacidosis
History
Patient was diagnosed with diabetes 7 years ago after presenting with diabetic ketoacidosis. Upon diagnosis he was given insulin in the hospital. Upon discharge he was given Metformin and Glimeperide (oral hypoglycemic medication – reason for oral agents unknown – likely because of his young age?). Defaulted Rx completely. Presented with DKA again. Restarted about 2 y ago on insulin.
The differential diagnosis at the current presentation is thus one of:
Ketosis prone diabetes
LADA (Latent auto-immune diabetes of the adult)
Type1 – went into honeymoon phase after diagnosis and now relapsed
To differentiate – the clinicians prompted to do antibodies, insulin levels and a glucagon stimulation c-peptide dynamic test.
Serum c-peptide has traditionally been thought to be an inconvenient method as immediate lab analysis is required before degradation (when collected in serum gel or plain sample tubes). This is because c-peptide is a small linear peptide, which is susceptible to enzyme proteolytic cleavage. Gel tubes are therefore traditionally required to be transported to the lab on ice, promptly centrifuged and separated, then stored in frozen conditions unless lab analysis is possible at that center.
However, c-peptide sample collection for c-peptide determination in whole blood in EDTA prepared tubes is stable at room temperature for up to 24 h. Venous blood c-peptide levels can be measured in the random, fasting, or stimulated scenarios. Random samples are taken at any time during the day without consideration of recent food intake, whereas fasting samples are taken after an 8- to 10-h fast.
Stimulation methods include using
glucagon
intravenous/oral glucose
tolbutamide
sulfonylurea
glucose-like peptide 1
amino acids
a mixedmeal
In this case a glucagon stimulation yielded sufficient results to assist the clinicians in making the diagnosis, indeed a case of atypical diabetes presentation.
An uncommon cause of unconjugated hyperbilirubinemia
HOSP #
WARD
Red Cross Endocrinology
CONSULTANT
Dr Jody Rusch
DOB/AGE
27 day female
Abnormal Result
TSH > 100
Free T4: 0.5 pmol/L
Presenting Complaint
Patient was brought to the ER being lethargic.
History
Term Neonate; Had a history of profound jaundice after birth, with unconjugated hyperbilirubinemia.
The patient’s mother lives in Athlone, gave birth at Carl Bremer hospital where a cord blood TSH was done, but results not available at the time.
Examination
No overt abnormalities on examination was found, except the single sign of jaundice.
No defects at the base of the tongue was observed.
No abnormalities in the neck was observed.
Laboratory Investigations
TSH > 100
Free T4: 0.5 pmol/L
Other Investigations
The patient had an ultrasound of the abdomen done (since it was the first occurence of hyperbilirubinemia, and in fact is termed pathological jaundice).
Cord blood TSH was retrospectively reviewed as being 178 uIU/ml.
Final Diagnosis
Congenital hypothyroidism
Take Home Message
Congenital hypothyroidism (CH) is thyroid hormone deficiency present at birth. If untreated for several months after birth, severe congenital hypothyroidism can lead to growth failure and permanent intellectual disability. Infants born with congenital hypothyroidism may show no symptoms, or may display mild symptoms that often go unrecognized as a problem. Significant deficiency may cause lethargy, hypotonia, hoarse cry, infrequent bowel movements, significant jaundice, and hypothermia.
Causes of congenital hypothyroidism include
iodine deficiency (most common cause)
developmental defect in the thyroid gland, either due to a genetic defect or a biochemical defect in thyroxine production
pituitary defects – congenital hypopituitarism (present at birth) may be the result of complications around delivery, or may be the result of insufficient development (hypoplasia) of the gland, sometimes in the context of specific genetic abnormalities.
Hypoglycemic seizures
HOSP #
MRN90378429
WARD
Endocrinology Ward
CONSULTANT
Jody Rusch
DOB/AGE
14 y girl
Abnormal Result
Fingerprick glucose 2.9 mmol/L
Presenting Complaint
Hypoglycemic seizure
History
The patient is a known type 1 diabetic patient who presented to the Internal Medicine Paediatric specialist OPD during two occasions of hypoglycemic seizures before.
The pateint had, according to the mothed, no post-ictal state.
She was admitted to the Endocrinology ward for a fast provocation test. At two hours, the glucose measured 2.9mM on point-of-care glucometer – glucose and other parameters on laboratory values however is illustrated below.
2 weeks after this presentation patient presented again with hypoglycemic seizures – mother is a nurse – puts in drip after which the patient’s condition normalizes.
On examination the patient had no signs and symptoms of hypoglycemia (during the provocative test). And after the hypoglycemic seizure there were no “post-ictal” symptoms identified.
Urine organic acid analysis profile: The 3 prominent peaks on the left are from left to right: B-hydroxybutyrate, Acetoacetate (with TMS derivative 1), Acetoacetate 2nd peak (with TMS derivative 2). TMS = trimethylsilyl derivative reagent, PDA = pentadecanoic acid (internal standard).
Final Diagnosis
Type 1 Diabetes with ketoacidosis and occasional episodes of hypoglycemia
Possible reasons for the hypoglycemia may be:
Ketogenic diet (fairly easily excludable I think).
There are two predominant ketone utilisation disorders: SCOT deficiency and beta-ketothiolase deficiency. These disorders produce fairly continuous ketones, as they cannot be metabolised in the muscle and brain upon these deficiencies, which are autosomal recessive (as is most inherited metabolic diseases).
Giving the mother a urine dipstick home to measure urine at home mane before meals, midday just before meals and late afternoon or so before meals may be advised to assist with the diagnosis of one of the above disorders.
Urine organic acid analysis can sometimes pick up a marker to diagnose beta-ketothiolase deficiency:
Figure 2 – The metabolism of Isoleucine and valine (credits to George van der Watt). In beta-ketothiolase deficiency, alpha-methyl-beta-keto-butyrate will accumulate, and can be detected on urine organic acid analysis by GC-MS.
A classic case of Cushing Disease
HOSP #
165965617
WARD
Endocrine Ward
CONSULTANT
Dr Heleen Vreede
DOB/AGE
33 y female
Abnormal Result
Salivary Cortisol = 36 nmol/L
Presenting Complaint
Struggling with a right hand abscess – seen at the hand surgeons for the abscess. She ascribed this hand abscess due to “easy bruising”.
The patient is stable but feeling generally unwell with proximal muscle weakness.
Reported symptoms of depression.
History
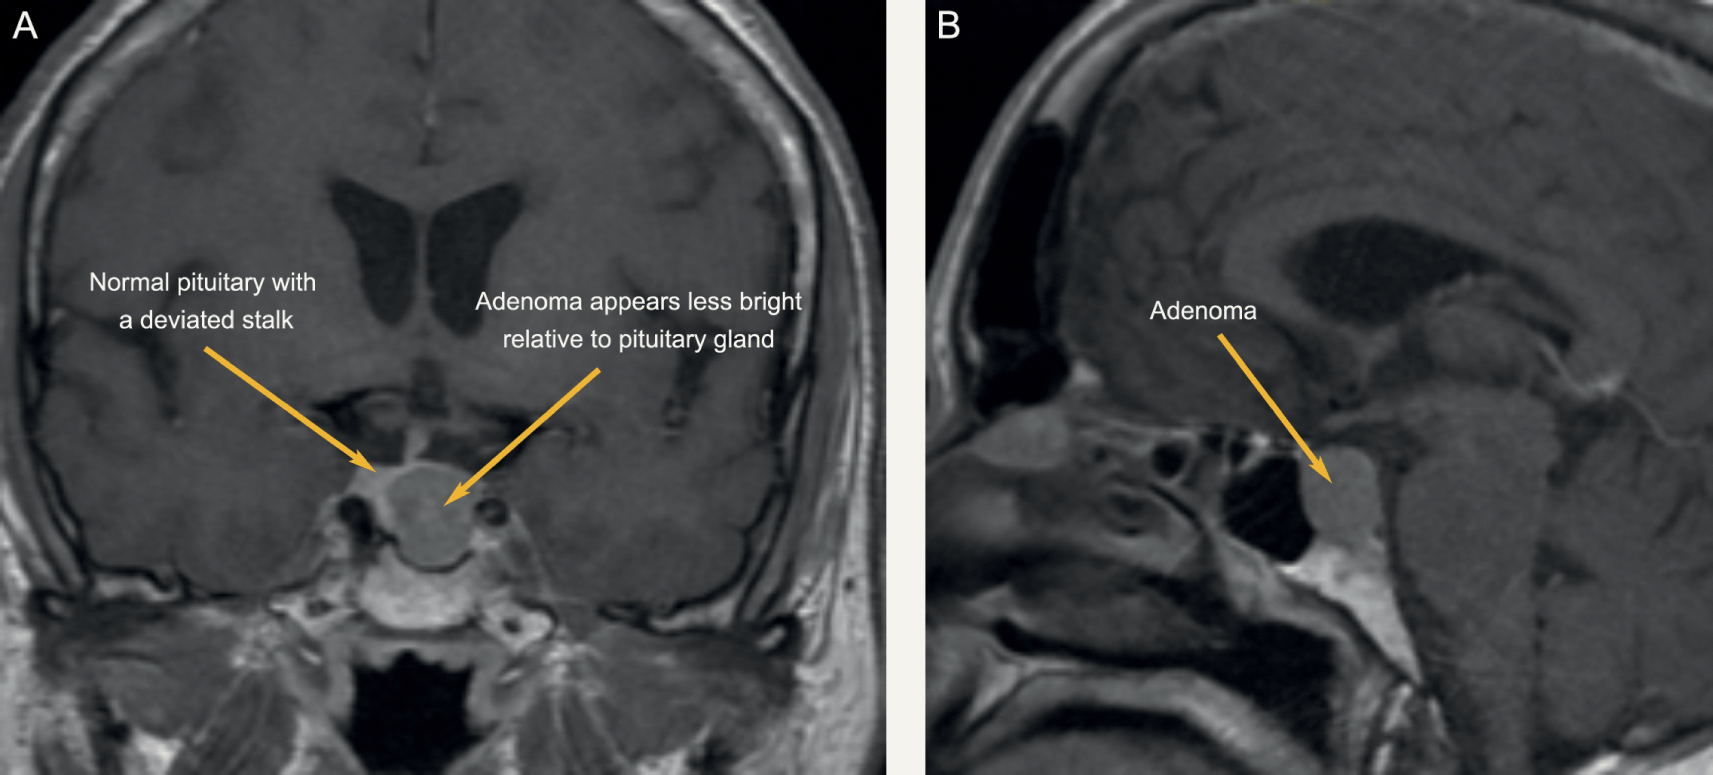
In 2017 a pituitatry microadenoma was diagnosed after the patient presented with weight gain, moon facies, easy bruising and being weak proximally.
The Cushings disease is ACTH – dependent (determined with a DDAVP stimulation test – see below).
The patient was known to Endocrinology and Neurosurgery departments and unfortunately had lost two of her booked surgery dates for transsphenoidal petrosal sinus sampling due to the COVID pandemic. She was then
Hypertension on ACEi, HCTZ, Amlodipine
Examination
On this visit the patient was found to have proximal muscle weakness, and had signs and symptoms of a severe depressive episode.
Laboratory Investigations
25/02/2021
25/02/2021
26/02/2021
9:30
17:00
0:00
642
636
675
Cortisol (nmol/L) at different time points in the day – indicating a loss of the diurnal variation.
CT Scan in 2017 confirmed a microadenoma of the pituitary gland (<1cm)
Figure 1 – DDAVP stimulation test in 2018
From figure 1, a 37.6% increase in cortisol is observed (722 to 994 nmol/L).
Final Diagnosis
ACTH- dependent Cushings Syndrome (Cushings Disease). The patient was initiated on Ketokonazole, an antifungal which has shown to decrease cortisol in some patients in a multicenter study where they mention it’s “worth a try” (J Clin Endocrinol Metab. 2014 May;99(5):1623-30. doi: 10.1210/jc.2013-3628). The liver enzymes in this patient didn’t increase significantly (not shown).
The patient does get intermittent hypokalemia (2.9mM the morning of presentation) but the clinicians are hesitant to start on spironolactone. Potassium was being replaced. One of the Endocrinologists (Dr Bill Toet) also advised stopping the HCTZ since it may worsen hypokalemia
Depression – likely related to the hypercortisolism – patient was initiated on fluoxetine.
Take Home Message
Thiazide diuretics increase the excretion of sodium, chloride, and water by inhibiting sodium ion transport across the renal tubular epithelium. Although thiazides may have more than one action, the major mechanism responsible for diuresis is to inhibit active chloride reabsorption at the distal portion of the ascending limb or, more likely, the early part of the distal tubule (i.e., the cortical diluting segment). Exactly how chloride transport is impaired is unknown. Thiazides also increase the excretion of potassium and bicarbonate, and they decrease the urinary excretion of calcium and uric acid. Hydrochlorothiazide may be used to reduce hypercalciuria and prevent the recurrence of calcium-containing renal calculi. By increasing the sodium load at the distal renal tubule, hydrochlorothiazide indirectly increases potassium excretion via the sodium-potassium exchange mechanism. Hypochloremia and hypokalemia can cause mild metabolic alkalosis.
Salivary Cortisol: The cortisol concentration in saliva is 10-fold lower than total serum cortisol and accurately reflects the serum concentration, both levels being lowest around midnight. A meta-analysis for 11 studies analysed, found mean sensitivity and specificity of the salivary cortisol assay were both >90%. This analysis confirms the reliability of the saliva cortisol assay as pragmatic tool for the accurate diagnosis of Cushing syndrome.
Close monitoring of liver enzymes is necessary when patients are initiated on ketokonazole, as it is prone to cause hepatitis.
An interesting cause of hyponatremia
HOSP #
WARD
Red Cross Hospital Oncology ward
CONSULTANT
Dr Amith Ramcharan / Dr Jody Rusch
DOB/AGE
11y Female
Abnormal Result
Persistent hyponatremia
2018 supracellar JPA (Astrocytoma)
Seizures – phenobarb.
Chemo @ 8 y of age.
Vincristin and Carboplatin administration
Craniospinal radiation – leptospinal
Presenting Complaint
Seizures – controlled with Phenobarbital
History
This is an 11 year old patient with a suprasellar JPA (Juvenile Pilocytic Astrocytoma). The tumour was diagnosed at 8y of age, upon which chemotherapy with Vincristine and Carboplatin was initiated. The pituitary was close to the area of radiation therapy as well.
Examination
The patient’s hydration status was normal and there was no cerebral edema.
Laboratory Investigations
2018 – Electrolytes relatively stable2018-2019 – Hyponatremia and hypomagnesemia developing
The patient was found to have hypothyroidism and started on T4 replacement 50ug mane.
Other Investigations
Urine electrolytes on 23/02/2021:
Na 54 mM
K 31.3 mM
Cl 110 mM
Osmol 554 mOsmol
Fractional reabsorption of phosphate: 85%
Final Diagnosis
Unknown – but likely indicates a tubular loss of sodium due to the chemotherapeutic agent(s).
Take Home Message
Chemotherapeutic agents does cause tubulopathy.
TMP/GFR is likely a better indicator of renal phosphate handling than only fractional reabsorption of phosphate. This can be calculated mathematically or read from a nomogram.
Falsely decreased glucose
HOSP #
WARD
Antenatal Clinic
CONSULTANT
Dr Heleen Vreede
DOB/AGE
30y Female
Abnormal Result
Glucose of < 0.1 mmol/L in a healthy individual being compos mentis.
Presenting Complaint
The patient is following up for routine check-up concerning possible hyperglycemia.
History
The mother is a known diabetic on treatment.
Examination
N/A
Laboratory Investigations
Glucose at 11h00
<0.1 mmol/L
Glucose at 14h00
1.5 mmol/L
Glucose at 20h00
2.6 mmol/L
Glucose at 06h00 (next morning – the day on which bloods were sent to the laboratory)
6.2 mmol/L
Index results at current visit obtained from glucose spead
Other Investigations
Glucose at 11h00
0.8 mmol/L
Glucose at 14h00
2.6 mmol/L
Glucose at 20h00
2.1 mmol/L
Glucose at 06h00 (next morning – the day on which bloods were sent to the laboratory)
5.7 mmol/L
Previous glucose spread in November 2020
The condition of the collection tubes were confirmed. All were taken in the correct collection tubes (Sodium Fluoride tubes) and appears to be correctly labelled.
Fig. 1 – The blood collection tubes of this patient.
The conclusion from above findings are the following:
Not enough NaF was present in the sample to adequately inhibit glycolysis, enabling a falsely decreased glucose reading in the older samples (>12 hours old).
The patient wasn’t aware that the powder should stay in the tube when blood is collected, hence discarded the powder before taking her capillary blood samples.
Take Home Message
Microtainer (R) specimen containers can be identified without the caps by the colour of the writing on the outside of the tube (in this case grey – the same colour as the cap).
The presence of the correct collection tube does not equal the presence of the additive.
Attention to detail is necessary to solve cause and effect in some cases.
In this case the nursing staff in the Antenatal clinic was informed about the powder in the collection tubes which should not be discarded. The nurse whom I spoke to was completely unaware that the powder in the collection tube served any function.
Glucose measurement from capillary blood samples, as in this case, can likely be inaccurate due to many possible pre-analytical (or analytical) reasons. It is however still likely a valid alternative to a resource-constrained setting, especially in South Africa, where patients cannot afford their own glucometers or where there are shortages of handheld glucometers, or more importantly, glucose measuring sticks (or cartridges).
Hyponatremia with a urine sodium measurement
HOSP #
WARD
Khayelitsha Hospital Emergency Unit
CONSULTANT
Dr. Heleen Vreede
DOB/AGE
64y female
Abnormal Result
Serum Sodium of 124 mmol/L
Presenting Complaint
A 64 year old female, presented to the Emergency unit at Khayelitsha Hospital with worsening hyponatremia.
History
The patient had a prior cholecystectomy 6 weeks ago. Histology thereon has shown chronic cholelithiasis but it was complicated with a polyp in the galbladder and adenocarcinoma thereof (completely excised during the cholecystectomy).
Examination
Not available
Laboratory Investigations
Date
24/01/2021
23/01/2021
22/01/2021
11/01/2021
22/12/2020
04/12/2020
19/01/2016
Na
δ- 124 L
129 L
133 L
138
137
Urea
3,9
3,1
6,1
6,1
8,2 H
Creat
61
δ- 66
88
73
86
48 L
U Na
• 31
U K
• 14,9
Other Investigations
Liver enzymes were normal at the last measurement (23 January), inflammatory markers normal, COVID-PCR negative on 11/01/2021.
Unfortunately neither the volume status, serum nor urine osmolarity was available on this patient’s history.
Final Diagnosis
Urinary sodium loss in one form or another. The appropriate response in hyponatremia is to decrease urinary sodium loss. In this patient, the urinary sodium was 31 (should ideally be <20 mmol/L in hyponatremia).
Unfortunately only the urinary sample was sent to our laboratory and it wasn’t possible to assess serum osmolarity.
The volume status was also not available, which is one of the necessities to adequately interpret hyponatremia OR hypernatremia.
Take Home Message
Salt never goes without water – similarly Sodium shouldn’t be interpreted without the volume status of the patient, and the serum (or urine if applicable) osmolarity.
In hyponatremia one expects the kidneys to respond adequately and hold back sodium, hence decreasing urinary sodium (to <20 mmol/L).
Assuming the patient’s osmolarity was low (by estimation formula) the following possibilities ensue:
Patient Hypervolemic: the high urine sodium points toward renal failure.
Patient Hypovolemic: Renal loss (diuretics / mineralocorticoid deficiency)
Patient Euvolemic: Urine osmolarity should be measured:
Urine Osmol >100: SIADH; Hypothyroidism; Hypoadrenalism (although urine Na usually >30); Stress ; Drug use.
Variable urinary osmolarity: Needs a “reset” of the osmostat by fluid restriction.
Furthermore: Indicators of renal insufficiency in this patient is the increased creatinine above the patient’s baseline of 48 uM. The creatinine has risen to 88 uM on one occasion. Although not above the reference interval for women, this value constitutes a (88-48)/48 = 83% increase in the creatinine and likely will indicate Acute Kidney injury, probably one of the most overlooked causes of morbidity in hospitalised patients in my opinion.
Beta-HCG’s half life
HOSP #
WARD
Labour Ward
CONSULTANT
Dr. Jody Rusch
DOB/AGE
23 y Female
Abnormal Result
The beta-HCG measured 1.3 million IU/L initially, then decreased significantly after an induced abortion.
Presenting Complaint
A 23 year old lady, at 36 weeks gestation presented with signs and symptoms of Hyperthyroidism. She also had a “retained placenta with hydatid mole” quoted from the request form
History
The patient presented with a gradual onset of hyperthyroidism signs and symptoms during the pregnancy.
Examination
Retained products of conception. This was subsequently removed and sent for histology (see below).
Laboratory Investigations
Episode
SA02847149
SA02854036
SA02854698
SA02863861
Date
14/03/2019
17/03/2019
18/03/2019
20/03/2019
Time
13:03
00:47
01:12
15:37
Beta-HCG
1 319 797
203 195
81 165
21 567
Other Investigations
Histology
MACROSCOPY: Specimen consists of a large amount of placental tissue fragments with grape-like structures noted, the largest measuring 14mm in diameter. The largest fragment of tissue measures 155 x 50 x 35mm. The entire specimen weighs 374g.
MICROSCOPY: Sections of placental tissue demonstrate heterogeneity in villous size with large, hypertrophic villi and small fibrotic villi identified. The enlarged villi are irregularly shaped with scalloped borders, and cistern formation. Circumferential mild trophoblastic hyperplasia is noted in some of the villi. Foci of micro-infarction are noted. Overall features are consistent with a partial hydatidiform mole.
PATHOLOGICAL DIAGNOSIS: Retained products of conception (placenta), biopsy:
Final Diagnosis
Gestational trophoblastic disease, consistent with a partial hydatidiform mole
Hyperthyroidism likely due to the similarity of the alpha subunit in HCG to the alpha-subunit of TSH, hence stimulating the TSH receptors.
Take Home Message
Graph illustrating the decrease in the B-HCG values on subsequent days after initial measurement on the day the products of conception was removed by dilatation and curettage (day 0).
According to the only source I could find during a quick literature search, I came upon the phrase:
Plasma beta-HCG concentration falls according to a multi-exponential curve with a half-life of 0.63 days in the first 2 days following induced abortion, and of 3.85 days in the subsequent 14 days
van der lugt et al – Disappearance of HCG after induced abortion, 1985
Considering the above, I endeavoured on the task of calculating the half life of the HCG between the 4 time points using Prof Pillay’s method:
F=0.5^(t/T), where F=fraction left, t=time difference and T=half life (units to be kept constant for t and T).
An important log-transformation rule to remember in this case is the logarithm power rule:
Logarithm power rule
logb(x y) = y ∙ logb(x)
Thus to calculate the half life between two time points (after rearranging formula above):
T= (t * log(0.5)) / log(F)
Hence
Between days 0 and 2.5:
T = (2.5 * log(0.5))/ log(203 195/ 1 319 797)
T (or half life) = 0.92 days
Similarly between days:
2.5 and 3.5: T= 0.76 days
3.5 and 6.15: T = 1.39 days
This corresponds fairly to the quoted 0.63 days which increases on subsequent days after abortion.
The discrepancy could likely be explained due to:
some degree of high dose hook effect at the high HCG concentrations,
high coefficient of variation at high immunoassay analyte concentrations with assays using a sigmoidal calibration curve,
variation in the methods of abortion compared to or
gestational age upon which abortion is done, to name a few.
Nonetheless the above equation from Prof Tahir Pillay is useful to calculate half life.
It is important to screen for hyperthyroidism in patients with hydatid moles and ensure that the TFT’s return to normal when the HCG returns to normal.
A serum albumin of 2 g/L
HOSP #
WARD
Victoria Hospital – Internal Medicine
CONSULTANT
Jody Rusch
DOB/AGE
30 y/o Female
Abnormal Result
Albumin = 2 g/L
Previous Albumin results: 5 g/L; 11 g/L; 8 g/L all 3 months apart respectively.
Presenting Complaint
The patient did not present with any complaints and the bloods taken was for follow-up only.
History
Patient is known with HIV, diagnosed in 2019 with a CD4 count of 250 cells/uL at the time.
ANA, ANCA, Hepatitis B negative
C3 & C4 normal
The patient presented previously with a left renal vein thrombosis, kidney sizes 150mm and 149mm respectively.
Examination
Not available.
Laboratory Investigations
Current CD4 count= 140 cells/uL.
Urine protein:creatinine ratio of 0.42 (multiple previous values of >1.5 though)
Total Cholesterol 4.2 mmol/L
Other Investigations
Histology
MACROSCOPY: Specimen consists of a single pale core measuring 6mm in length.
MICROSCOPY: Glomeruli: There are a total of 9 glomeruli present. There are no globally sclerosed glomeruli and there are no crescents present. Focal segmental lesions are present. Neutrophils are frequently identified within capillary loops (endocapillary hypercellularity). There is mild focal segmental increase in mesangial cellularity. Glomerular basement membranes appear mildly increased in thickness in areas. There are no features of collapsing FSGS. Podocytes appear prominent. Focal areas suspicious for early spike formation are noted on Jones silver stain.
Tubules: Tubules show protein resorption droplets with focal areas of ATI. Areas of tubular atrophy and thyroidisation are present. Tubular microcysts are not a feature.
Interstitium: Moderate lymphoplasmacytic inflammation is present.
Ultra-thin resin sections show the presence of electron dense deposits with subepithelial and intramembranous location in keeping with membranous nephropathy.
Ehrenreich-Churg stage: 1-2
Immunohistochemistry: IgG4: negative.
PATHOLOGICAL DIAGNOSIS:
Features in keeping with membranous nephropathy.
Final Diagnosis
Membranous Nephropathy
Take Home Message
Severe hypoalbuminemia can occur in nephrotic syndrome. One should ascertain before authorizing such a severely deranged result, that it is not due to a sample type swop of kinds. The history of previously low albumin results was in this case confirmatory. The other features of nephrotic syndrome should also be sought, which is hypertriglyceridemia (no triglyceride value was available in this patient but the Total cholesterol was 4.2 mmol/L).
HIVICK (HIV immune complex disease of the kidney) continues to be an important cause of nephropathy in HIV-naive patients in South Africa. In contrast to HIVAN where the HIV infects the podocytes primarily, HIVICK boasts itself in the fact that it indirectly causes disease by initiating an immune response.
This approach utilizes a completely different offensive strategy that eliminates the need to directly infect the kidney one cell at a time as is the case in HIVAN.
HIVICK is an immune complex attack on the kidney that leads to a variety of histopathologic glomerular lesions: membranous, diffuse/membranoproliferative, IgA nephropathy. The unique aspect of these immune complexes is their composition involving specific HIV antigens as the source target of the antibody response. Therefore the development of HIVICK is completely dependent on the presence of active HIV viremia.
Not known. Unfortunately no clinical information is known and only a single result is available.
Final Diagnosis
Probably a benign raised caeruloplasmin
Take Home Message
This case, sent through by Dr. John Stanfliet (Pathcare) prompted thorough read-up on caeruloplasmin:
What is the function of caeruloplasmin?
Caeruloplasmin is an alpha-2 glycoprotein that stores and transports copper in the blood. It is produced primarily by the liver. It is to copper what ferritin is to iron. The primary physiological role of caeruloplasmin, however, is acting as a catalyst for reduction and oxidation (redox) reactions.
How is it measured?
Caeruloplasmin is usually measured by immunoturbidimetry or immunonephelometry.
Other methods employed are: oxidation of o-dianisidine (ODA) or that of the traditional reductant, p-phenylenediamine (PPD).
What causes a low caeruloplasmin?
Primary deficiency is rare.
Secondary deficiency is more common and causes include
(2) inability to transport Cu2+ from the GI epithelium into the circulation (as in Menkes disease), or
(3) defective incorporation of Cu2+ into the developing caeruloplasmin molecule (as in Wilson disease)
What are causes of an elevated caeruloplasmin?
Concentrations are increased significantly by estrogens (e.g. pregnancy or with the use of oral contraceptives).
It is also a positive acute phase protein thus increased in inflammation. High levels can be seen in active liver disease and in young children where levels can be 50% higher.
High levels is apparently also present in those with lymphoma and rheumatoid arthritis.
Other interesting facts
The normal levels of ceruloplasmin in serum are more or less 10x lower than that of transferrin in molar and mass units.
Caeruloplasmin reference ranges in mass and molar units (in grey)
Hypercalcemia with uric acid crystals
From other results it is also evident that:
HOSP #
WARD
Nephritic clinic
CONSULTANT
Dr. Heleen Vreede
DOB/AGE
49 y Female
Uric acid nephropathy with hypercalcaemia (Mrs. Linda Meyer) MRN78959694
Abnormal Result
The calcium on 20/02/2019 on bloods taken 14h45 was 3.29 (2.15-2.50 mmol/L).
Presenting Complaint
The patient presented with pain “from loin to groin” which is the typical presentation of passing a renal stone.
History
The patient has chronic renal failure (first creatinine was 362 umol/L with eGFR of 12ml/min – MDRD) on 12 December 2017. Creatinines relatively unchanged since then.
Upon re-evaluation of the case in 2020 it was seen that the baseline creatinine has risen to ~445 umol/L indicating a worsening of the chronic renal failure eGFR now 9 ml/min – by both CKD-EPI and MDRD formulas.
Examination
N/A
Laboratory Investigations
The patient is known with Hyperuricemia, first result 0.50 (0.16-0.36mmol/L) on 16 February 2018. The response to treatment appears poor due to continuing rising serum uric acid levels (considering whether the patient is on allopurinol).
2. Regarding the hypercalcemia:
Episode
SA04315821
SA03552076
SA03535628
SA02816641
SA02784405
SA02622825
SA02369770
SA02123812
SA01901592
Date
11/11/2020
11/12/2019
04/12/2019
04/03/2019
20/02/2019
12/12/2018
04/09/2018
23/05/2018
16/02/2018
Time
09:44
10:22
17:03
15:48
17:44
17:11
10:31
16:25
15:28
Na
135 L
139
138
139.000
138.000
137.000
K
5,3 H
4,7
4,8
4,8
4,5
4.320
4.400
4.780
Urea
17,2 H
14,3 H
16,2 H
11,3 H
18,8 H
17,1 H
Creat
443 H
484 H
434 H
444 H
446 H
475 H
334 H
408 H
415 H
MDRD
9
8
9
9
9
8
13
10
10
CKD-EPI
9
Ca
2,79 H
2,59 H
3,09 H
3,29 H
2,97 H
2.820 H
2.850 H
3,12 H
Mg
0.94
1,05
1.00
1.060 H
.980
Phos
1,02
1,25
1,33
.980
1.240
1.110
PTH
13,3 H
4,3
4,6
Cumulative history of UEC and CMP with PTH.
From above results a consistent hypercalcemia with a single raised PTH result can be seen – see “Final Diagnosis” and “Take Home Message” below.
Other Investigations
Uric acid crystals were seen on the urine microscopy reflecting uric acid nephropathy – a possible cause of the chronic renal failure, but I could not find any biopsy result or alternative explanation for the renal failure and assume it is uric acid nephropathy. The patient also appears to have been for a procedure at Urology (? Renal stone removal).
A serum protein electrophoresis with immunofixation (13/09/2018) showed no monoclonal peaks.
Final Diagnosis
Uric acid nephropathy with renal stones.
Hypercalcemia likely due to tertiary hyperparathyroidism.
Take Home Message
Uric acid nephropathy appears to be an uncommon cause of chronic kidney disease (ref. Up-to-date).
It should however be emphesized that clinicians consider the cause on a differential, as it is a manageable cause.
Hypercalcemia sometimes occur in Chronic Kidney Disease patients due to tertiary hyperparathyroidism. This is due to persistent hyperphosphatemia with resulting hyperparathyroidism leading to hypercalcemia (as opposed to the more commonly occuring hypocalcemia is renal failure).
——Commentary by Nephrologist- Dr. Erika Jones——
WRT the Uric Acid
Difficult to say if it is cause or effect of CKD. We can only really make a diagnosis of uric acid nephropathy on kidney biopsy. But it is definitely a cause that we see on occasion.
The good news is that the creatinine has remained fairly stable in the last couple of years, unlike the UA, but as kidney function deteriorates it is expected the UA will increase.
According to our buff records she had staghorn calculi and that was labelled as the cause of her CKD.
Allopurinol in CKD is challenging as it accumulates with side effects. We have had two patients with full on Steven’s Johnson Syndrome. So if she isn’t symptomatic I wouldn’t give it to her. She is recorded as having Sarcoidosis which explains the hypercalcaemia. I think this stage is too early to have tertiary hyperparathyroidism.
Query EDTA contamination
HOSP #
MRN96038757
WARD
F17 Surgical ward
CONSULTANT
Dr. Jody Rusch
DOB/AGE
26 y male
Abnormal Result
Potassium more than 10 mmol/L on the ion-selective electrode.
Presenting Complaint
The patient was admitted in surgery after bowel surgery, on total parenteral nutrition.
History
Surgery was done due to bowel obstruction.
Examination
Not available.
Typically:
A hallmark of small bowel obstruction is dehydration, which manifests as tachycardia, orthostatic hypotension, and reduced urine output, and, if severe, dry mucus membranes.
●Abdominal inspection will identify a variable degree of abdominal distention.
●Abdominal auscultation – Acute mechanical bowel obstruction is characterized by high-pitched “tinkling” sounds associated with the pain. With significant bowel distention, bowel sounds may become muffled, and as the bowel progressively distends, bowel sounds can become hypoactive.
●Abdominal percussion – Distention of the bowel results in hyperresonance or tympany to percussion throughout the abdomen. However, fluid-filled loops will result in dullness. If percussion over the liver is tympanitic rather than dull, it may be indicative of free intra-abdominal air. Tenderness to light percussion suggests peritonitis.
●Abdominal palpation may identify any abdominal wall or groin hernias, or abnormal masses.
Laboratory Investigations
Date
16/03/2020
14/03/2020
13/03/2020
12/03/2020
12/03/2020
11/03/2020
10/03/2020
08/03/2020
Time
07:22
10:38
10:30
19:59
12:32
21:23
16:05
12:53
Na
144
141
141
δ- 138
143
δ+ 145
140
K
>10
2.6
3.0 L
3.0 L
INVH
3,2 L
δ+ 3,7
3.0 L
Cl
Urea
4.4
5,1
5.0
5,5
6,9
δ+ 5,5
2,5
Creat
47
60 L
60 L
64
67
66
62 L
Ca
1.63
2,24
2,27
2,13 L
2,23
2.30
2,23
Mg
0.38
δ- 0.67
δ+ 0.90
0.77
0.82
0.75
0.74
Phos
1.1
1.50 H
1,31
1,28
1,38
1,23
1,17
Uric acid
Total prot
CEGK
CEGK
Alb
30
39
40
Total bili
<3
3 L
4 L
Conj bili
2
INVH
2
ALT
35
28
32
AST
33
INVH
28
ALP
118
137 H
158 H
GGT
99
96 H
113 H
LD
138
δ+ 465 H
317 H
CRP
2
7
6
Table 1 – Results in bold indicative of likely EDTA contamination.
Other Investigations
Repeated results later in the afternoon:
Date
16/03/2020
16/03/2020
Time
13:04
07:22
Na
144
144
K
δ+ 3,3 L
>10
Cl
Urea
4.6
4.4
Creat
55
47
Ca
2.2
1.63
Mg
0.56
0.38
Phos
1.06
1.1
Uric acid
Total prot
CEGK
CEGK
Alb
37
30
Total bili
3 L
<3
Conj bili
2
2
ALT
46
35
AST
40
33
ALP
151
118
GGT
121
99
LD
230
138
CRP
2
2
Initial results on the right. Repeated (new) results on the left.
Final Diagnosis
Likely EDTA contamination causing a falsely elevated potassium, decreased Calcium, Magnesium and ALP. The clinician was contacted and it was indeed medical undergraduate students who had taken the bloods, probably not realizing the order of draw, or toppling up the serum blood with some of the blood taken in an EDTA tube. This is evidenced by the high potassium, low calcium, magnesium and ALP. It is however evident that most other analytes were also lower than the repeat bloods later that day, hence:
Another likely possibility of the results in question could have been drip line contamination due to a potassium-containing fluid. The patient was indeed on total par-enteral nutrition, which usually contain large doses of potassium. This could be explained by the dilution of most analytes (as opposed to the raised potassium and normal sodium).
Take Home Message
It does not require much potassium EDTA contamination to evoke spuriously abnormal results. Potassium EDTA works as an anticoagulant by inhibiting clotting by chelation of the divalent cations such as calcium and magnesium, essential for the divalent cation-dependent proteolytic enzymes involved in the clotting cascade.
Gross potassium EDTA contamination of blood samples can be recognized by unexpected marked pseudohyperkalaemia and pseudohypocalcaemia. Serum alkaline phosphatase (ALP) activity can also be reduced in the presence of potassium EDTA contamination. Additionally, aspartate transaminase, alanine transaminase, lactate dehydrogenase, creatine kinase, amylase, unsaturated iron-binding capacity and bicarbonate can all be detrimentally affected in the presence of potassium EDTA contamination. Notably, some papers report potassium EDTA contaminated samples were mainly from inpatients compared to outpatients and primary care and the authors speculated that this is because blood samples in outpatients and general practice are largely but not exclusively collected by trained phlebotomists. It is our job as laboratorians to educate the newly trained clinicians about order of draw.
It is unfortunate that I couldn’t locate the undergraduate student who had taken these bloods, but at least the attending clinician was made aware of EDTA contamination.
Discrepant TFT’s
HOSP #
WARD
Endocrine Clinic (OPD)
CONSULTANT
Dr. Jody Rusch
DOB/AGE
32 Year female
Abnormal Result
The clinician, an endocrinologist, phoned about discrepant results: Suppressed TSH, Low Free T4 and Normal (upper end of reference interval) Free T3.
Date
09/12/2020
TSH (mIU/L)
0.05 L
Free T4 (pmol/L)
4,8 L
Free T3 (pmol/L)
6,4
Presenting Complaint
The patient was known with Graves Disease complicated by quite severe Graves Eye Disease (orbitopathy).
History
Known with Graves disease with positive antibodies to TSH-receptors.
Examination
The clinical examination for this patient is not available, but the following is important:
Interestingly, patients may have no ocular symptoms at all, but may sometimes be distressed by the appearance of their eyes. The major ocular symptoms include:
A gritty or foreign object sensation
Excessive tearing that is often made worse by exposure to cold air, wind, or bright lights
Eye or retroocular discomfort or pain
Blurring of vision
Diplopia
Color vision desaturation
Loss of vision in severe cases
The characteristic signs of Graves’ orbitopathy are proptosis (exophthalmos), tearing, and periorbital edema. In more severe disease, there may be severe conjunctival inflammation and ulceration from over exposure.
Laboratory Investigations
Date
09/12/2020
11/05/2020
08/11/2019
24/05/2019
29/01/2019
10/12/2018
TSH (mIU/L)
0.05 L (Rerun 0.05)
0.02 L
<0.01 L
<.01 L
<.01 L
Free T4 (pmol/L)
4,8 L (Rerun 4.9)
65,7 H
δ+>100.0 H
48,4 H
42,7 H
44 H
Free T3 (pmol/L)
6,4 (Rerun 6.4)
19,6 H
As above, the history of Graves disease is clear, which includes a suppressed TSH and raised Free T4 and Free T3.
Other Investigations
The Free T4, Free T3 and TSH was re-run on 10/12/2020, QC checked on these three analytes (all was within normal range) and pre-analytical labeling errors excluded as far we could.
Final Diagnosis
Graves eye disease, now with hypothyroidism.
Take Home Message
In Graves’ disease, the main auto-antigen is the thyroid-stimulating hormone (TSH) receptor (TSHR), which is expressed primarily in the thyroid but is also expressed in adipocytes, fibroblasts, and a variety of additional sites and appears to be closely aligned with the insulin-like growth factor 1 (IGF-1) receptor. TSHR antibodies and activated T cells also play an important role in the pathogenesis of Graves’ orbitopathy by activating retro-ocular fibroblast and adipocyte TSHR and IGF-1 receptors and initiating a retro-orbital inflammatory environment.
The retro-orbital tissue (and ocular muscles) increase in volume due to this inflammatory milieu, fibroblast proliferation and the accumulation of hydrophilic glycosaminoglycans (GAG’s), most notably hyaluronic acid.
Sometimes orbitopathy occurs in patients with hypothyroidism (high TSH, low free T4) due to classical chronic autoimmune thyroiditis (Hashimoto’s disease), and these patients may have stimulating TSH receptor (TSHR) antibodies but inadequate thyroid reserve.
In summary, the most important factors for development of Graves Eye Disease (orbitopathy) seems to be:
Graves Orbitopathy antigen (which is the TSH-receptor): these are expressed extra-thyroidally, especially retro-orbitally.
Role of TSH receptor antibodies
Role of T-cells: Retroocular fibroblasts secrete GAG in response to cytokines such as interferon gamma and tumor necrosis factor (TNF)-alpha secreted by helper (CD4+) T cells of the Th1 type.
In cases of hypothyroidism, the action of deiodinase is increased to protect against the effects of hypothyroidism, likely the explanation of the increased Free T3 in this patient (compared to the low Free T4).
Rapidly decreasing Prolactin result
HOSP #
WARD
Endocrinology Clinic
CONSULTANT
John Stanfliet
DOB/AGE
36 y Female
Abnormal Result
A low prolactin result was obtained in a patient in whom a macroadenoma was suspected:
Prolactin: 1.3 mIU/L
Presenting Complaint
The patient presented with headache and decreased visual acuity (more specifically peripherally).
History
There were bilateral galactorrhoea, amenorrhoea, and as noted above, headache and visual disturbances.
The patient had received Cabergoline (a dopamine receptor agonist on D2 receptors) for the past 4 months.
Examination
As above
Laboratory Investigations
Date
Prolactin (mIU/L)
02/2019
106 (Recovery of 80% following PEG precipitation)
05/2019
135
06/2019
85
08/2019
1.3 (1.59 with a 1:10 dilution; 3.94 with a 1:50 dilution)
Prolactin Results
Other Investigations
MRI Head was booked for the following week. Interestingly, even in prolactin secreting tumours, the correlation between tumour size and prolactin level is limited. MRI head remains a vital investigation.
Final Diagnosis
Pituitary Macroadenoma
Take Home Message
During pregnancy the concentration of prolactin rises under the influence of elevated estrogen and progesterone production. The stimulating action of prolactin on the mammary gland leads post partum to lactation. Hyperprolactinemia (in men and women) is the main cause of fertility disorders. The determination of prolactin is utilized in the diagnosis of anovular cycles, hyperprolactinemic amenorrhea and galactorrhea, gynecomastia and azoo-spermia. Prolactin is also determined when breast cancer and pituitary tumors are suspected. As in this case, a pituitary tumour was suspected, hence the repeated prolactin results.
As was noted in another short case, our assay on the Roche platform does measure all forms of prolactin, and when a high result is obtained (above the gender-specific reference range) it is recommended to measure the recovery after PEG precipitation.
Dr. John Stanfliet (pathologist at Pathcare) repied to the above case with very valuable comments:
We use Beckman Coulter DxI, an immunoassay that is not affected by macroprolactin (I’ve include an article that shows this).
Even in prolactin secreting tumours, the correlation between tumour size and prolactin level is limited. MRI head remains a vital investigation.
Some prolactin secreting tumours also secrete other pituitary hormones such as growth hormone.
I would ascribe the reduction in PRL to the Carbegoline and wonder whether the dose has been increased.
Dr. Pete Berman would often suggest a mixing study: find a sample with high PRL, mix it 50/50 with this sample, and measure it to see whether there is some interferant in this sample.
Patient presented with signs and symptoms of iron deficiency anemia.
History
The patient is a known hemophilia B carrier (Factor IX deficiency or Christmas disease) with menorrhagia and accompanying iron deficiency anemia.
Examination
The patient presented to the emergency rooms with symptoms of severe weakness and had occasional severe menorrhagia.
Unfortunately the physical examination details are not available.
Laboratory Investigations
Iron: 4.5 umol/L (9-30.4) Low
Transferrin 3.92 g/L (2-3.6) High
% Saturation 5% (15 -50) Low
Ferritin 8 ug/L (13- 68) Low
Other Investigations
Anti-Thyroglobulin (anti-TG) antibodies as well as Anti-Thyroid Peroxidase (anti-TPO) antibodies were positive in this patient.
These antibodies was suggested after the results of the TSH and reflexed free-T4 became available and hence after-requested.
Final Diagnosis
The pattern of significantly raised TSH with the significantly low free-T4 and the raised anti-TPO and anti-Thyroglobulin antibodies suggest primary hypothyroidism.
Take Home Message
It’s always worth doing a TSH to screen for thyroid disease when a patient presents with weakness / tiredness, irrespective of the age.
Primary hypothyroidism due to an auto-immune mediated destruction of the thyroid gland tissue is the most common hypothyroid condition and is confirmed by measuring the common anti-thyroid antibodies: Anti-TPO and Anti-TG antibodies. There is likely not much indication for performing these antibodies more than once after diagnosis of hypothyroidism and some clinicians argue it not necessary to even perform these antibody measurements.
Congenital hypothyroidism is one of the congenital disorders causing cretinism which is most preventable by newborn screening. Even though not likely congenital in this patient, it’s worth considering on the differential diagnosis.
The patient was on iron supplements as well as Factor IX injections. I was not aware of an association between Factor IX deficiency and Hypothyroidism, but my Haematology colleagues across the corridor told me the following:
Factor IX deficiency is an X-linked recessive disorder. This makes it unlikely for a female to get this disease. Auto-immune diseases is much more likely in females. There is also a form of Christmas disease where one produces antibodies to factor IX, which yields it inactive, hence presenting as Factor IX deficiency.
This, although unlikely, presents an interesting thought for this unusual presentation in this 16-year old female. Acquired deficiencies of most clotting factors have been described.
However, upon discussion with the attending clinician it seems that the patient did have a clear family history of Christmas disease, hence the presentation.
A case of Cryptococcal meningitis with hypomagnesemia
HOSP #
WARD
Victoria Hospital Female medical ward
CONSULTANT
Heleen Vreede
DOB/AGE
29y female
Abnormal Result
The magnesium result measured 0.36 mmol/L ( 0.63 – 1.05 mmol/L) despite adequate levels prior to admission to hospital (0.75 mmol/L on 18/04/2020).
Presenting Complaint
The patient was asymptomatic with regards to the at the time when the result was obtained.
History
Patient was diagnosed with Cryptococcal Meningitis on 22/04/2020 with a cryptococcal latex agglutination test.
Patient was known HIV positive with a CD4-count of 9 cells/uL (332-1642).
Examination
Unfortunately this data is not available.
The clinical features of hypomagnesemia is predominantly related to the derangement in the calcium becoming deranged when hypomagnesemia occurs.
Laboratory Investigations
Other Investigations
None available.
Final Diagnosis
Hypomagnesemia with accompanying hypocalcemia due to Amphoterecin B therapy
Take Home Message
I’ve learned from the attending clinician (and a short literature search) that Hypomagnesemia is a known consequence of Amphotericin B therapy.
Hypocalcemia is often a consequence of hypomagnesemia (as in this case). This is due to two known mechanisms:
Decreased sensitivity of Calcium at the calcium-sensing receptor, with decreased secretion of PTH and hence its effects.
Decreased action of PTH due to PTH-receptor resistance being caused by hypomagnesemia.
A pepper-pot skull?
HOSP #
WARD
General Practitioner Practice in Robertson
CONSULTANT
Dr. Jody Rusch
DOB/AGE
83 year Male
Abnormal Result
Serum protein electrophoresis demonstrates a 4.4 g/L, IgG kappa monoclonal peak in the gamma region.
Presenting Complaint
Complains of bilateral hip pain and RUQ discomfort.
History
Atrial fibrillation on Xarelto.
2 x CABG
Examination
RUQ pain and tenderness
Hear rate regular
Laboratory Investigations
Urine protein electrophoresis: No Bence Jones protein
Serum free light chains:·
Kappa 62.87 mg/L (3.30-19.40)·
Lambda 19.63 (5.71-26.30)·
K:L ratio 3.20 (0.26-1.65)
Creatinine 108 (eGFR 56)
Calcium 2.42 mmol/l
Albumin 40 g/L
Hb 12.7 (11.0-16.0)
Other Investigations
U/S shows gallstones.
X-Ray of pelvis shows “sclerotic changes to both hips and pelvis”
Final Diagnosis and Take Home Message:
1. What is the likely diagnosis
This 83 year old male with multiple co-morbidities presenting with signs and symptoms suggestive of multiple myeloma, confirmed on SPE as IgG Kappa.
CRAB criteria before performing SPE: C- R+ A- B+ (2/4)
Bony pain could be secondary to lytic bone lesions associated with MM, but also possibly to due sclerotic/ wear-and-tear when considering his age. RUQ pain is likely due to gallstones.
Renal impairment – this is probably normal renal function for an 83 year old man
In medicine generally an eGFR < 60 is representing renal impairment (stage 3)
However, in monoclonal disease eGFR < 40 or serum Cr > 177 is the cut-point
Bone lesions – myeloma classically causes lytic bone lesions, e.g. “pepper-pot skull”
It was suggested that the clinician talks to the radiologist as to whether the X-Rays were in keeping with myeloma.
2. Critically discuss whether this patient needs a bone marrow biopsy.
The patient’s age along with co-morbidities would concern any drastic intervention:
he will be an anesthetic risk for BM Bx to be performed in theatre (assuming that is standard procedure), and
will the BM biopsy give add anything further to the already established IgG Kappa diagnosis, which can be treated accordingly.
The case should ideally be discussed with Oncology. A bone marrow biopsy is done under local anaesthetic. The bone marrow will allow the haematologist / oncologist to assess the degree of marrow clonal infiltration. The important cut-offs are 10 & 60%. This is important to decide on diagnosis, stage, prognosis, treatment and later, the response to treatment. The criteria for doing a bone marrow biopsy at our centre are:
Positive CRAB·
IgG monoclonal peak > 15 g/L·
IgM or IgA monoclonal·
FLC K:L > 10
Why is there a lower (10%) limit for degree of marrow clonal infiltration? Is there a link to immunoparesis? One likely always has some clonal expansion in bone marrow, probably a normal or a non-pathological finding.
3. Discuss the serum FLC in the setting of the renal impairment.
FLC are filtered and reabsorbed by the nephron under normal circumstances, along with other LMW proteins. During a plasma cell dyscrasia, the nephron is overwhelmed by the amount of FLC (stemming from monoclonal origin), can cause renal impairment. Hence, renal function being part of the CRAB criteria. Furthermore, renal impairment itself (in the absence of MM), can cause elevated Kappa and Lambda FLC – usually with a slight higher ratio =3.2.
In patients with renal failure, there is greater retention of serum free light chains. It is difficult to interpret ratios ranging between 1.65 – 3.0 in the context of renal insufficiency. In such cases, further investigation with a 24-hour urine protein electrophoresis and urine immunofixation helps to guide interpretation. If both of these subsequent studies are normal and the patient has no other symptoms suggestive of a plasma cell dyscrasia, then the increased ratio is likely due to the renal insufficiency.
4. Discuss electrophoresis briefly.
Electrophoresis is a general term that describes the separation of charged particles/ ions under the influence of an electric field – in this case the charge of proteins. Migration of proteins is based on their charge, size and velocity (product of their mobility and field strength) Make sure you understand why the proteins are charged the importance of NET charge and how we keep those charges stable in the field. If I can take a crack at this: The overall NET charge of the molecule is based on the number of elements (incl. amino acids with varying side-chains moeities) (I think this is the confusion when some mention that electrophoresis is based on charge, and also size. I don’t necessarily think that the two are synonymous), and each amino acid has different degrees of charge based on their differing R-group. The stability of the charges within the field is achieved by running the sample solution through a buffer. Right about the buffer. Remember that size and charge are two different physical aspects that you can use to separate molecules. For example, a DNA gel is a separation purely based on size. The net charge is the same on all the molecules. The net charge in proteins is from the side chains, which is why you have to learn about neutral, acidic and basic amino acids. The side chains have different pKa’s and so are charged differently.
a. What is the difference between capillary and gel electrophoresis. Explain which your lab uses and why.
What I described in Q4 was basically the concept of gel electrophoresis where agarose gel is used as the medium in which the proteins are separated according to their size, charge, and interaction with the medium itself. At TBH we use gel electrophoresis, but will soon be getting a Minicap/ CZE. CZE: As with gel electrophoresis, CZE also separates ions based on their electrophoretic mobility with the use of an applied voltage – all dependent on the charge of the molecule, viscosity and particle size. CZE’s voltage is much higher compared to GE – quicker results. The buffer/ mobile phase of CZE uses an electrolyte filled capillary, where eletro-osmotic flow (EOF) is generated: similarly sized and charged ions move together and are subsequently separated and detected at different time intervals.The more voltage you apply the faster the separation occurs. However, the limiting factor is that applying high voltages generates a lot of heat which can denature proteins, thereby altering their conformational shape and changing their NET charge. Capillaries are much more effective at shedding heat as they are long and thin. Thus, very high voltages can be applied and the run time is much shorter. In gel electrophoresis, you measure how far the molecules travel in a set time, e.g. 1 hour. In capillary electrophoresis, the distance that the molecules move is set and so you measure the time it takes for the molecules to travel that set distance (like running a 100m race).
The way I reconcile how the CZE differential seperation works is by the
driving force of the buffer through the tubing (forward force)
negative charge on the side of the tube (retarding force)
NET charge on the molecule (many amino acids=higher charge, eg Albumin) (determine degree of retardation of flow)
Voltage powers the whole system
5. Why is the serum FLC abnormal but not the urine protein electrophoresis?
UPE’s sensitivity is limited due to the reabsorption of FLC in the renal tubules. FLC in urine will only be detected until loss of tubular function/ tubules are overwhelmed by FLC volumes. This patient’s Kappa FLC of 63 mg/L in serum should be detected on UPE, but tubular function is seemingly still intact with little being excreted.
Some are of the opinion that SPE and SFLC is the preferred method to screen for myeloma because of higher sensitivity and specificity, as opposed to SPE and UPE, which may have a slightly lower sensitivity.
It should however be noted that quoted sensitivities and specificities are usually based on retrospective audits of patients who eventually end up in a myeloma clinic. So, it is not sure what the sensitivity and specificity is if you just screen the general population, older people, people with some vague symptoms…
6. Against which epitopes are the FLC assay directed?
The FLC epitopes are located between the interface between the light and heavy chains and are “hidden” – when bound to Ig, they will not be detected. Only when these epitopes are “free”, can they be detected, hence free light chains. They are directed at 2 hidden epitopes.
7. Why is the FLC assay polyclonal and not monoclonal?
The biggest decider many times is COST, but lets put that aside for now.
It appears that polyclonal assays are more robust and have higher yields in product during testing and easier to make. They are unfortunately less specific, but this is not the most critical when one wants to measure the FLC broadly, instead of particlularly specific sites.
Epitopes are three dimensional shapes that the antibody binds to. This is determined by the amino acid sequence. One drawback with polyclonal assays is that lot to lot will vary. The difficulty is to maintain consistency in further production and / or distrubution of the antibody – it is not a simple process to ensure consistency.
8. Describe how a monoclonal antibody is made for use in an assay.
Inject a rabbit (or other animal) with the protein of choice. In three weeks, the rabbit will have produced antibodies to the protein. The rabbit is sacrificed (killed) and the spleen harvested. The spleen is ground up and the cells are put in a culture with a certain myeloma cell line. The culture medium contains colchicine that induces the rabbit cells and the myeloma cells to fuse. It also contains HAT medium: hypoxanthine, aminopterin and thymidine. This specific myeloma cell line cannot recycle thymidine in the presence of hypoxanthine.
So in the culture there are now three cell lines.
Firstly, there are the rabbit cells that haven’t fused; these will die because they are not immortal.
Secondly, there is the myeloma cell line, this will also die because of the recycling problem.
Finally, there is a fused cell line that will survive .
Each of these surviving cell lines will produce one Ig against one part of the protein. Now the researchers take the medium and put a tiny amount into a well. The amount is so small that on average each well will contain only one cell; some will of course contain nothing. Then, each well is targeted against the protein and the most promising ones are investigated further. An immortal Ig producing factory directed against one epitope and based on one cell line, a single clone, or as we’d call it a monoclonal, has been produced. Each manufacturer’s produced immunoglobulin is different and may produce better or worse results.
9. The GP, in Robertson, wants some advice on how to proceed. What do you tell him?
A multidisciplinary approach would be best:
Treatment for the lytic bone lesions (after opinion by radiology): bisphosphonate
Assess overall medication and lifestyle to determine overall risk for worsening renal dysfunction (drugs, co-morbidities……always suggest stopping smoking/drinking)
Prevention of thrombotic/infective episodes
Treatment of any further abnormalities should they arise (hypercalcaemia, anaemia etc.)
Specialist referral:
Haematoncologist for treatment of MM: UPE , Bone marrow biopsy
General surgery for gallstone
10. Is there any relevance for the RUQ/gallstone pain in myeloma specifically?
There are some reports where cholecystitis has presented in MM (mets etc), but it is not a separate entity on its own (such as in POEMS), this is simply the real world where elderly patients have more than one pathology.