Intellectual disability

HOSP # WARD Endocrine clinic
CONSULTANT   Prof George van der Watt DOB/AGE 17 year old boy

Abnormal Result

High TSH, low T4.

Presenting Complaint

Intellectual impairment

History

This 17 year old boy from Zimbabwe arrived in South Africa at +/- 8 years of age – diagnosed with hypothyroidism (thyroid dysgenesis)

The thyroid functions have never been well-controlled.

Examination

The patient had significant intellectual impairment – impairment in communication, mother struggling to take care of him, and severly impaired social skills.

Laboratory Investigations

Useful tests to perform to assess for the source of thyroid hormone dysgenesis include:

Tests to assess pituitary function:

  • ACTH (or cortisol)
  • TSH (would generally be low in pituitary causes of cretinism)
  • LH
  • FSH
  • Growth hormone
  • Prolactin (posterior pituitary)

Other Investigations

Thyroid scans (scintigraphy) is not required for diagnosis, but may provide important information on the position of the thyroid.

Thyroid ultrasound is an alternative to determine location of the thyroid gland in the neck, but may fail to detect some tissues.

A lateral radiograph of the knee may be obtained to look for the distal femoral epiphysis; this ossification center appears at about 36 weeks’ gestation, and its absence in a term or postterm infant indicates prenatal effects of hypothyroidism.

Final Diagnosis

Thyroid dysgenesis

Take Home Message

Thyroid biological functions

  • Control of basal metabolic rate
  • Enhancement of mitochondrial metabolism
  • Neural development and growth
  • Sexual maturation
  • Adrenergic stimulation
  • Protein synthesis and carbohydrate metabolism
  • Synthesis and degradation of cholesterol and triglycerides
  • Increases calcium and phosphate metabolism

Congenital Hypothyroidism’s incidence appears to be 1:2000 – 1:4000 live births – Likely the most common preventable cause of intellectual disability worldwide.

Types / causes:

  • Thyroid dysgenesis
  • TSH Resistance
  • Disordered thyroid hormone secretion or synthesis
  • Defect in thyroid hormone transport
  • Defects in thyroid hormone metabolism
  • Thyroid hormone resistance
  • Central hypothryoidism
  • Transient congenital hypothyroidism

Newborn screening pre-requisites:

  • Direct benefit to the neonate from early dianosis
  • This benefit is reasonable balanced against financial and other costs
  • There is a reliable test, suitable for neonatal screening
  • There is a satisfactory system in place to handle testing, counselling, treatment and follow-up of positive screens.

Criteria for an effective population-wide screening test (e.g. on all
newborns):

  1. Availability of a test that is a) cheap and b) reliable
  2. Condition is treatable, has high morbidity, and preferably is reasonably common

Criteria required before performing ante-natal diagnostic tests:

  1. A reliable and safe diagnostic test is available
  2. There is a significant risk of the foetus having the suspected IMD.
  3. Condition is serious enough to warrant offering termination and is not treatable.
  4. Parents are willing to consider termination of pregnancy if foetus is shown to be affected.

WHO screening criteria (2008)

  • The screening programme should respond to a recognized need.
  • The objectives of screening should be defined at the outset.
  • There should be a defined target population.
  • There should be scientific evidence of screening programme effectiveness.
  • The program should integrate education, testing, clinical services and programme management.
  • There should be quality assurance, with mechanisms to minimize potential risks of screening.
  • The program should ensure informed choice, confidentiality and respect for autonomy.
  • The program should promote equity and access to screening for the entire target population.
  • Program evaluation should be planned from the outset.
  • The overall benefits of screening should outweigh the harm.

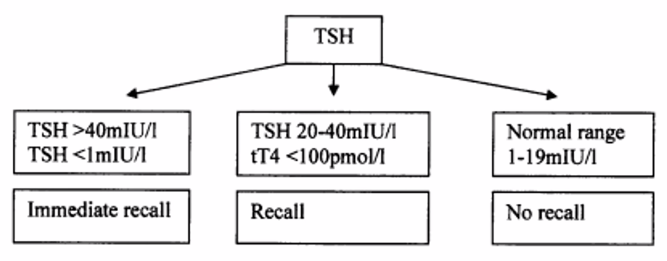
Newborn screening strategies:

  • Test TSH with a reflex T4 if TSH is high
  • T4 with reflex TSH if T4 low
  • Heel prick (day 2-5 of life) vs cord blood
  • Repeat screen at 2-6 weeks?
  • Confirmation tests TSH + T4 or fT4
The testing plan with the RIA TSH ELISA used at Red Cross Children’s hospital

Problems with congenital hypothyroidism screening in South Africa

  • Long recall success and high default rate
  • Long delays before review and to starting treatment

Only 34% patients are contactable in SA after testing positive (audit by Dr. Michelle Carrihil). Many patients who were recalled – still defaulted.

Treatment

Levothyroxine is the Rx of choice. The aim is to raise T4 and normalise the serum TSH. If given withing the first 2 weeks of life, it can prevent intellectual impairment in >90% of cases.

Conclusion

  • This patients intellectual impairment and the associated social implications of this could have been prevented with an effective screening programme.
  • Screening programmes despite being projected to be effective, can have many unforeseen difficulties
  • Auditing screening programmes regularly and implementing improvements is a necessary part in ensuring its efficacy

References

  1. Carrihill, M. 2008. An audit of the thyroid screening programme in the Peninsula Maternal and Neonatal Services. University of Cape Town.
  2. https://www.who.int/bulletin/volumes/86/4/07-050112/en/
  3. Uptodate section on congenital hypothyroidism
  4. BURTIS, C. A., ASHWOOD, E. R., BORDER, B., & TlETZ, N. W. (2001). Tietz fundamentals of clinical chemistry. Philadelphia, WB. Saunders.
  5. Medscape section on congenital hypothyroidism


Lactate:Pyruvate ratio

  1. Don’t measure L:P-ratio when lactate is <2.2mM

If lactate is high:

  1. L:P will be high in mitochondrial problems (hypoxia, mt cytopathy, complex deficiencies) – the common ones.
  2. L:P will be low (<20) in PDHC deficiency, glycogen storage disease,


Correcting the Myth of Calcium Correction

By Dr. Janet Simons on June 26, 2019

By Dr. Janet Simons (biography, no disclosures)

What gap I have noticed

Calcium levels are commonly ordered in both primary and acute care in patients with a variety of signs and symptoms. Hypocalcemia (total calcium concentrations generally below 2.0 mmol/L or ionized calcium below 1.15 mmol/l) is usually related to dietary deficiencies or disorders of the parathyroid axis, such as in patients with previous surgery or autoimmune destruction of the parathyroid gland. Hypercalcemia (above 2.5 mmol/L total calcium or 1.3 mmol/L ionized) in primary care is commonly associated with dehydration, primary hyperparathyroidism, and malignancy such as multiple myeloma. When hypercalcemia is severe, generally defined as total calcium above 3.5 mmol/L or ionized calcium above 2.0 mmol/L, therapy should be initiated immediately. Values of calcium below this threshold but above 3.0 mmol/L total calcium or 1.75 mmol/L ionized are considered moderate hypercalcemia and patients with calcium values in this range may not need immediate therapy but should be monitored closely. Precise values of normal ranges and cut offs may vary between laboratories.

Serum Calcium Level

It remains common practice to apply the Payne formula (usually expressed as albumin-adjusted calcium (mmol/L) = total calcium (mmol/L) + 0.02 [40 – albumin (g/L)]) (1) to adjust total calcium. This correction is intended to enhance the ability of the total calcium concentration to serve as a marker of the physiologically relevant parameter, ionized calcium, in patients with hypoalbuminemia.

Since the original Payne paper, clinical use of this correction formula has spread such that many clinicians routinely apply this ‘correction’ to all total calcium measurements. This observation is supported by data available from Vancouver Coastal Health and Providence Health Care laboratories. In 2018, total serum calcium and albumin were ordered together 72% of the time, suggesting that many clinicians believe that serum albumin measurement is required in order to interpret total calcium concentrations.

There are a number of problems with the Payne formula. This formula was derived in 200 patients whom Payne considered to be unlikely to have abnormalities of ionized calcium, however 20% of the patients had hyperproteinemia secondary to multiple myeloma. Payne et al relied upon results from a single laboratory which used methodologies for the measurement of albumin and total calcium which are different from methods in routine use today. The formula was designed to transform the calcium results in those patients who had hypoalbuminemia so that the distribution of results would match the distribution of calcium results in the patients with normal serum albumin concentrations. There was no validation of the formula using ionized calcium, which was not measured.

What data addresses this gap

There is considerable evidence (2-12) that application of the Payne formula tends to misclassify the calcium status of patients and performs less well than simply evaluating uncorrected total calcium. Payne himself recently wrote a letter to the editor (13) in which he acknowledged that his original formula is not universally applicable, requiring modification for the specific albumin assay in use by a laboratory, and that any albumin-based adjustment will likely overestimate calcium in patients with renal failure. In renal failure, the albumin concentration is underestimated when uremia induced carbamylation of albumin reduces its detection by the assay (14). Attempts to derive a new formula (10-12) to improve upon the performance of the Payne formula have failed to find a correction which performs significantly better than unadjusted total calcium.

The physiological basis for the albumin adjustment is the theory that when albumin is reduced, the amount of calcium bound to albumin is also reduced, such that the total serum calcium may be low despite a normal ionized calcium concentration. However, this physiologic basis is belied by evidence that in hypoalbuminaemic states, the binding constant between albumin and calcium changes, and more calcium binds to each available gram of albumin (15). Formulae such as the Payne formula which assume a constant relationship between albumin concentration and the fraction of calcium which is bound to albumin are thus expected to overestimate ionized calcium in patients with low albumin. Several studies have borne out this tendency of correction formulae to overestimate ionized calcium.

Steen et al (2) found that in patients with albumin <30 g/L, 75% of patients classified as normocalcemic using the Payne formula in fact had hypocalcemia based on ionized calcium levels. Another study (3) found that adjusted calcium values derived by applying the Payne formula agreed with ionized calcium levels in only 55-65% of patients. In contrast, unadjusted total calcium correctly categorized 70-80% of patients. Agreement between adjusted calcium and ionized calcium was even worse for patients with renal impairment (eGFR<60 min/mL/1.73m2). The adjustment significantly overestimated calcium concentrations in these patients. A similar trend has been documented in critically ill patients in both the medical and surgical ICU settings (4-6).

The poor performance of the calcium correction has also been observed in the hypoalbuminemic geriatric population (7). Again, the correction impairs the sensitivity of the corrected result to detect true hypocalcemia. The more severe the hypoalbuminemia, the poorer the performance of the adjustment formula. This has also been demonstrated in stable hemodialysis patients (8-9).

Other studies (10-11) have sought to derive new formulae for the purpose of correcting calcium for albumin concentration. James et al (10) considered many possible formulae but ultimately concluded that if any adjustment is to be made to calcium to account for hypoalbuminemia, the adjustment formula must be locally derived.

Many of the studies above were done in hospital inpatients. Less data is available in outpatients, as ionized calcium is more difficult to measure in this population due to the requirement that specimens for ionized calcium be analyzed promptly after collection (16). However, a study which examined results from both inpatients and outpatients of a hospital and excluded critically ill patients (12) confirmed that unadjusted total calcium performs better than any of the available correction formulae (including those put forth by Payne and James) in ROC analysis compared to the ionized calcium gold standard.

What I recommend (practice tips)

Formulae to adjust total calcium for the albumin concentration should be abandoned. The use of these formulae overestimates ionized calcium in patients with hypoalbuminemia, causing false negatives for hypocalcemia and false positives for hypercalcemia. Measurement of ionized calcium is now relatively inexpensive and is available in most hospitals and many outpatient settings.

  1. Measurement of ionized calcium is recommended over total calcium when calcium homeostasis is in question.
  2. If calcium is ordered as a ‘screening’ test without specific clinical suspicion for a disorder of calcium homeostasis, it is reasonable to assess unadjusted total calcium. If this level is abnormal, confirmation with ionized calcium may be sought prior to further workup or therapy.
  3. Where ionized calcium is not available, total calcium should be assessed without the application of any correction formula.
  4. Order serum albumin only if clinically indicated for reasons other than adjusting total calcium.

References

  1. Payne RB, Little AJ, Williams RB, Milner JP. Interpretation of serum calcium in patient with abnormal serum proteins. Br Med J. 1973;4:643-646. DOI: 10.1136/bmj.4.5893.643. (View)
  2. Steen O, Clase C, Don-Wauchope A. Corrected calcium formula in routine clinical use does not accurately reflect ionized calcium in hospital patients. Canad J Gen Int Med. 2016;11(3):14-21. DOI: 10.22374/cjgim.v11i3.150. (View)
  3. Smith JD, Wilson S, Schneider HG. Misclassification of calcium status based on albumin-adjusted calcium studies in a tertiary hospital setting. Clin Chem. 2018;64(12):1713-1722. DOI: 10.1373/clinchem.2018.291377. (Request with CPSBC or view with UBC)
  4. Slomp J, van der Voort PH, Gerritsen RT, Berk JA, Bakker AJ. Albumin-adjusted calcium is not suitable for diagnosis of hyper- and hypocalcemia in the critically ill. Crit Care Med. 2003;31:1389-1393. DOI: 10.1097/01.CCM.0000063044.55669.3C. (View with CPSBC or UBC)
  5. Dickerson RN, Alexander KH, Minard G, Croce MA, Brown RO. Accuracy of methods to estimate ionized and “corrected” serum calcium concentrations in critically ill multiple trauma patients receiving specialized nutrition support. JPEN J Parenter Enteral Nutr. 2004;28(3):133-141. DOI: 10.1177/0148607104028003133. (Request with CPSBC or view with UBC)
  6. Byrnes MC, Hunyh K, Helmer SD, et al. A comparison of corrected serum calcium levels to ionized calcium levels among critically ill surgical patients. Am J Surg. 2005;189(3):310-314. DOI: 10.1016/j.amjsurg.2004.11.017. (View with CPSBC or UBC)
  7. Sorva A. ‘Correction’ of serum calcium values for albumin biased in geriatric patients. Arch Geron Geri. 1992;15(1):59-69. DOI: 10.1016/0167-4943(92)90040-B. (Request with CPSBC or view with UBC)
  8. Clase CM, Norman GL, Beecroft ML, Churchill DN. Albumin-corrected calcium and ionized calcium in stable haemodialysis patients. Nephrol Dial Transplant. 2000;15:1841-1846. DOI: 10.1093/ndt/15.11.1841. (Request with CPSBC or view with UBC)
  9. Gouri A, Dekaken A. A comparison of corrected serum calcium levels to ionized calcium levels in haemodialysis patients. Ann Biol Clin (Paris). 2012;70:210-212. DOI: 10.1684/abc.2012.0693. (Request with CPSBC or view with UBC)
  10. James MT, Zhang J, Lyon AW, et al. Derivation and internal validation of an equation for albumin-adjusted calcium. BMC Clin Pathol. 2008;8:12. DOI: 10.1186/1472-6890-8-12. (View)
  11. Antonio JM. New predictive equations for serum ionized calcium in hospitalized patients. Med Princ Pract. 2016;25:219-226. DOI: 10.1159/000443145. (View)
  12. Lian IA, Asberg A. Should total calcium be adjusted for albumin? A retrospective observational study of laboratory data from central Norway. BMJ Open. 2018;8:e017703. (View)
  13. Grzych G, Pekar JD, Durand G, Deckmyn B, Maboudou P, Lippi G. Albumin-adjusted calcium and ionized calcium for assessing calcium status in hospitalized patients. Clin Chem. 2019;65(5). DOI: 10.1373/clinchem.2018.300392. (Request with CPSBC or view with UBC)
  14. Kok MB, Tegelaers Fp, van Dam B, van Rijn JL, van Pelt J. Carbamylation of albumin is a cause for discrepancies between albumin assays. Clinica Chimica Acta. 2014;434:6-10. DOI: 10.1016/j.cca.2014.03.035. (View with CPSBC or UBC)
  15. Besarab A, Caro JF. Increased absolute calcium binding to albumin in hypoalbuminaemia. J Clin Pathol. 1981;34:1368-1374. DOI: 10.1136/jcp.34.12.1368. (View)
  16. Glendenning P. It is time to start ordering ionized calcium more frequently: preanalytical factors can be controlled and postanalytical data justify measurement. Ann Clin Biochem. 2013;50:191-193. DOI: 10.1177/0004563213482892. (View with CPSBC or UBC)
  17. Carroll MF, Schade DS. A practical approach to hypercalcemia. Am Fam Physician. 2003;67:1959-1966. (View with CPSBC or UBC)


Conn’s syndrome with a focus on a unilateral adrenal gland

HOSP # Mrs DW WARD Endocrine Department – CathLab – UCT private Hospital
CONSULTANT   Dr Jody Rusch DOB/AGE 49y Female

Abnormal Result

49yr old female

Presenting Complaint

Medical complaint: Suspected Conn’s disease – right adrenal lesion/ irregular left adrenal gland

History

Past Medical History: Resistant Hypertension, primary hyperaldosteronism (confirmed previously with saline infusion test), hypokalaemia, hypercholesterolaemia, newly diagnosed DM.

Family History: Hypertension – Mother.

Past Surgical History: TAH – 7 years ago.

Allergies: Nil known

Smoker

Meds: Amlodipine/Valsartan 10/320 daily, Doxazosin 8mg daily, Furosemide 40mg daily, Spironolactone 25mg daily, Carvedilol 25mg daily, Metformin 1g nocte, Simvastatin 20mg nocte, Zolpidem 10mg nocte.

Examination

Not available

Laboratory Investigations

Other Investigations

Not available for this patient.

Ideally one would need a CT with contrast beforehand to adequately visualize the positions of the adrenal veins, as this may aid in the canulation, especially of the right adrenal vein.

One needs to diagnose hyperaldosteronism (by an appropriate salt loading test) before proceeding to bilateral adrenal vein sampling.

Final Diagnosis

Interpretation

Definition Formula Clinical significance
Selectivity index PCC(side) / PCC (ivc) >cutoff confirms canulation of adrenal vein
>3 stimulated
>2 unstimulated
Lateralization index PAC/PCC (dom) : PAC/PCC (non-dom) >cutoff confirms laterilization of hyperaldo secretion
>4 stimulated
>2 unstimulated
Contralateral suppression index PAC/PCC (non-dom) : PAC/PCC (ivc) <cutoff indicate ipsilateral suppression
and suggest contralateral
aldosterone overproduction.
Table 1 – Interpretation of bilateral adrenal vein sampling.
PCC: plasma cortisol concentration, PAC: plasma aldosterone concentration, ivc: inferior vena cava or peripheral vein, dom: dominant side, non-dom: non-dominant side.

Selectivity index

Right: 0.2 (mean)

Left: 2.8 (mean)

These two results indicate that the left adrenal has likely been canulated adequately, but the right vein inadequately.

Lateralization index

Unable to comment because of the inadequate canulation of the right adrenal vein. If determined, it would very likely provide a false result.

Contralateral suppression index

616.8 /1260.25 : 2540/3609

= 0.70

This falls in between some of the referenced cutoffs (<1 and <0.5)

All of the other samples also fall somewhere in this range. Biochemically, these results suggests inadequate right sided venous sampling (a commonly described problem)

Take Home Message

  • Procedure is done in the Cath Lab
  • The patient received continuous synacthen infusion
  • Done under imaging with contrast used for the localisation of the adrenal gland and adrenal vein
  • Sequential sampling technique used, generally > 20 mins infusion
  • Multi-disciplinary: nurses, anaesthetist, radiographer, intervention radiologists, students, chemical pathologists
  • Difficulty with sampling right side for both patients
  • Difficulty with interpreting results – most likely due to inadequate canulation of the right adrenal vein

Some important learning points

  1. Adrenal vein sampling may be a valuable tool that is underutilised
  2. Careful selection of patients essential – also patient should consent to surgical removal of the affected adrenal before this invasive procedure is initiated
  3. Inter-disciplinary approach is necessary
  4. Obtaining cosyntroponin (aka synacthen) can be difficult (Section 21), but recommended
  5. Right adrenal access difficult: may require specific imaging. Recommended to start on the right or do simulataneous sampling
  6. Adrenalectomy may be curative or help achieve better control of BP thus decrease associated morbidity and mortality in those with unilateral adenoma


Immune Responses to SARS-CoV-2 cause severe COVID-19 in some and recovery in most

Clive Gray – Professor in Immunology
immunopaedia.org – useful web site for immunology resources.

Outline:

  • Basics of Immunology
  • A balance between inflammation and tolerance
  • What happens to people who progress to severe COVID-19?
  • What might be happening in SARS-CoV-2 infected people who remain asymtomatic, have few symptoms and recover?

Internal : External world

~99% of time the pathogen gets destructed, but the pathogen may survive in rare cases.

2 arms of immune responses:

Innate – evolutionary response – very rapid – elements of innate immunity are found in bacteria, plants, lower vertebrates, squids, fish etc.

Some pathogens survive ->

Adaptive immunity – much more targeted / focussed. The immune system targets more specifically the pathogens which survive the innate immunity.

Infection initially -> expansion (peak after maximal viral load) -> contraction with some residual immunity (Memo Maintenance) -> with secondary response (Recall) there is a more rapid expansion (and higher peak) of the specific immunity.

Immune regulation:

Predisposed conditions: DM, HPT, Obesity, would make an individual highly susceptible to inflammation due to in imbalance of Inflammation vs. Tolerance, see below.

The Yin Yang of immunology:

Yin – immune regulation; Yang – Inflammatory Process

Pro-inflammatory (Orange)

TH17 – inflammatory cells secreting the “calling signals” for leucocytes.

TH1 – secreting IFN gamma; IL-2 ; TNF-alpha – cytokines causing inflammation

Macrophage – presents antigens – in lymph nodes and germinal centres

T-Helper cells T-FH

Immune Regulation (Blue)

TH2 – hand in hand with TH1 (opposite)

Regulatory cells (nT and iT regulatory cells)

Actual pathogen is not causing disease – but the immune response – thus this is what should be focussed on to treat the disease.

Dose of the virus (viral load) is key to how you respond to the virus – Initial High dose in viral load likely will lead to high inflammatory response; Low dose (non-robust virus replication) may cause a less severe inflammatory response.

CCL’s allow leucocytes to migrate, hence in a cytokine storm, with high level of migration, the leucocytes causes severe local inflammation due to migration of leucocytes to local sites.

CCL5 blocking antibodies leads to rapid reduction of IL-6.

Dexamethasone is not so much an inhibitor of CCR5, but it prevents the hyperinflammation by inhibiting the majority of the inflammatory pathway.

CD8 cells

Within interstisium, the CD8 cells are present and

CD4 cells activates CD8 cells, hence called T-helper cells.

T-cell responses are very prevalent to COVID-19 exposed individuals. BUT CD4 cells and CD8 cells can also react to the SARS2 viral proteins in unexposed individuals.
RBD – receptor binding domain (Spike-protein); Orange is the amount of amino acids which are changeable.
Orange amino acids are those which are changeable – illustrating how the virus has mutated in a month.


A pepper-pot skull?

HOSP # WARD General Practitioner Practice in Robertson
CONSULTANT   Dr. Jody Rusch DOB/AGE 83 year Male

Abnormal Result

Serum protein electrophoresis demonstrates a 4.4 g/L, IgG kappa monoclonal peak in the gamma region.

Presenting Complaint

Complains of bilateral hip pain and RUQ discomfort.

History

Atrial fibrillation on Xarelto. 

2 x CABG 

Examination

RUQ pain and tenderness

Hear rate regular

Laboratory Investigations

Urine protein electrophoresis: No Bence Jones protein

Serum free light chains:·         

  • Kappa 62.87 mg/L (3.30-19.40)·         
  • Lambda 19.63 (5.71-26.30)·         
  • K:L ratio 3.20 (0.26-1.65) 
  • Creatinine 108 (eGFR 56)
  • Calcium 2.42 mmol/l
  • Albumin 40 g/L
  • Hb 12.7 (11.0-16.0) 

Other Investigations

U/S shows gallstones.

X-Ray of pelvis shows “sclerotic changes to both hips and pelvis”

Final Diagnosis and Take Home Message:

1. What is the likely diagnosis

This 83 year old male with multiple co-morbidities presenting with signs and symptoms suggestive of multiple myeloma, confirmed on SPE as IgG Kappa.

  • CRAB criteria before performing SPE: C- R+ A- B+ (2/4)
  • Bony pain could be secondary to lytic bone lesions associated with MM, but also possibly to due sclerotic/ wear-and-tear when considering his age. RUQ pain is likely due to gallstones.
  • Renal impairment – this is probably normal renal function for an 83 year old man
  • In medicine generally an eGFR < 60 is representing renal impairment (stage 3)
  • However, in monoclonal disease eGFR < 40 or serum Cr  > 177  is the cut-point       
  • Bone lesions – myeloma classically causes lytic bone lesions, e.g. “pepper-pot skull”

It was suggested that the clinician talks to the radiologist as to whether the X-Rays were in keeping with myeloma.

2.       Critically discuss whether this patient needs a bone marrow biopsy.        

The patient’s age along with co-morbidities would concern any drastic intervention:

  • he will be an anesthetic risk for BM Bx to be performed in theatre (assuming that is standard procedure), and
  • will the BM biopsy give add anything further to the already established IgG Kappa diagnosis, which can be treated accordingly.

The case should ideally be discussed with Oncology. A bone marrow biopsy is done under local anaesthetic.  The bone marrow will allow the haematologist / oncologist to assess the degree of marrow clonal infiltration.  The important cut-offs are 10 & 60%.  This is important to decide on diagnosis, stage, prognosis, treatment and later, the response to treatment.  The criteria for doing a bone marrow biopsy at our centre are:         

  • Positive CRAB·         
  • IgG monoclonal peak > 15 g/L·         
  • IgM or IgA monoclonal·         
  • FLC K:L > 10

Why is there a lower (10%) limit for degree of marrow clonal infiltration? Is there a link to immunoparesis? One likely always has some clonal expansion in bone marrow,  probably a normal or a non-pathological finding. 

3.       Discuss the serum FLC in the setting of the renal impairment.        

FLC are filtered and reabsorbed by the nephron under normal circumstances, along with other LMW proteins. During a plasma cell dyscrasia, the nephron is overwhelmed by the amount of FLC (stemming from monoclonal origin), can cause renal impairment. Hence, renal function being part of the CRAB criteria. Furthermore, renal impairment itself (in the absence of MM), can cause elevated Kappa and Lambda FLC – usually with a slight higher ratio =3.2.

In patients with renal failure, there is greater retention of serum free light chains. It is difficult to interpret ratios ranging between 1.65 – 3.0 in the context of renal insufficiency. In such cases, further investigation with a 24-hour urine protein electrophoresis and urine immunofixation helps to guide interpretation. If both of these subsequent studies are normal and the patient has no other symptoms suggestive of a plasma cell dyscrasia, then the increased ratio is likely due to the renal insufficiency. 

4.       Discuss electrophoresis briefly.        

Electrophoresis is a general term that describes the separation of charged particles/ ions under the influence of an electric field – in this case the charge of proteins. Migration of proteins is based on their charge, size and velocity (product of their mobility and field strength) Make sure you understand why the proteins are charged  the importance of NET charge and how we keep those charges stable in the field. If I can take a crack at this: The overall NET charge of the molecule is based on the number of elements (incl. amino acids with varying side-chains moeities) (I think this is the confusion when some mention that electrophoresis is based on charge, and also size. I don’t necessarily think that the two are synonymous), and each amino acid has different degrees of charge based on their differing R-group. The stability of the charges within the field is achieved by running the sample solution through a buffer. Right about the buffer.  Remember that size and charge are two different physical aspects that you can use to separate molecules.  For example, a DNA gel is a separation purely based on size.  The net charge is the same on all the molecules.  The net charge in proteins is from the side chains, which is why you have to learn about neutral, acidic and basic amino acids.  The side chains have different pKa’s and so are charged differently. 

a.       What is the difference between capillary and gel electrophoresis.  Explain which your lab uses and why.

What I described in Q4 was basically the concept of gel electrophoresis where agarose gel is used as the medium in which the proteins are separated according to their size, charge, and interaction with the medium itself. At TBH we use gel electrophoresis, but will soon be getting a Minicap/ CZE. CZE: As with gel electrophoresis, CZE also separates ions based on their electrophoretic mobility with the use of an applied voltage – all dependent on the charge of the molecule, viscosity and particle size. CZE’s voltage is much higher compared to GE – quicker results. The buffer/ mobile phase of CZE uses an electrolyte filled capillary, where eletro-osmotic flow (EOF) is generated: similarly sized and charged ions move together and are subsequently separated and detected at different time intervals.The more voltage you apply the faster the separation occurs.  However, the limiting factor is that applying high voltages generates a lot of heat which can denature proteins, thereby altering their conformational shape and changing their NET charge.  Capillaries are much more effective at shedding heat as they are long and thin.  Thus, very high voltages can be applied and the run time is much shorter.  In gel electrophoresis, you measure how far the molecules travel in a set time, e.g. 1 hour.  In capillary electrophoresis, the distance that the molecules move is set and so you measure the time it takes for the molecules to travel that set distance (like running a 100m race).

The way I reconcile how the CZE differential seperation works is by the

  1. driving force of the buffer through the tubing (forward force)
  2. negative charge on the side of the tube (retarding force) 
  3. NET charge on the molecule (many amino acids=higher charge, eg Albumin) (determine degree of retardation of flow)
  4. Voltage powers the whole system 

5.       Why is the serum FLC abnormal but not the urine protein electrophoresis?        

UPE’s sensitivity is limited due to the reabsorption of FLC in the renal tubules. FLC in urine will only be detected until loss of tubular function/ tubules are overwhelmed by FLC volumes. This patient’s Kappa FLC of 63 mg/L in serum should be detected on UPE, but tubular function is seemingly still intact with little being excreted.

Some are of the opinion that SPE and SFLC is the preferred method to screen for myeloma because of higher sensitivity and specificity, as opposed to SPE and UPE, which may have a slightly lower sensitivity.

It should however be noted that quoted sensitivities and specificities are usually based on retrospective audits of patients who eventually end up in a myeloma clinic.  So, it is not sure what the sensitivity and specificity is if you just screen the general population, older people, people with some vague symptoms… 

6.       Against which epitopes are the FLC assay directed?        

The FLC epitopes are located between the interface between the light and heavy chains and are “hidden” – when bound to Ig, they will not be detected. Only when these epitopes are “free”, can they be detected, hence free light chains. They are directed at 2 hidden epitopes.

7.       Why is the FLC assay polyclonal and not monoclonal?

The biggest decider many times is COST, but lets put that aside for now.

It appears that polyclonal assays are more robust and have higher yields in product during testing and easier to make. They are unfortunately less specific, but this is not the most critical when one wants to measure the FLC broadly, instead of particlularly specific sites.

Epitopes are three dimensional shapes that the antibody binds to.  This is determined by the amino acid sequence. One drawback with polyclonal assays is that lot to lot will vary.  The difficulty is to maintain consistency in further production and / or distrubution of the antibody – it is not a simple process to ensure consistency.

8.       Describe how a monoclonal antibody is made for use in an assay.

Inject a rabbit (or other animal) with the protein of choice.  In three weeks, the rabbit will have produced antibodies to the protein.  The rabbit is sacrificed (killed) and the spleen harvested.  The spleen is ground up and the cells are put in a culture with a certain myeloma cell line.  The culture medium contains colchicine that induces the rabbit cells and the myeloma cells to fuse.  It also contains HAT medium: hypoxanthine, aminopterin and thymidine.  This specific myeloma cell line cannot recycle thymidine in the presence of hypoxanthine. 

So in the culture there are now three cell lines. 

  • Firstly, there are the rabbit cells that haven’t fused; these will die because they are not immortal. 
  • Secondly, there is the myeloma cell line, this will also die because of the recycling problem. 
  • Finally, there is a fused cell line that will survive . 

Each of these surviving cell lines will produce one Ig against one part of the protein.  Now the researchers take the medium and put a tiny amount into a well.  The amount is so small that on average each well will contain only one cell; some will of course contain nothing.  Then, each well is targeted against the protein and the most promising ones are investigated further.  An immortal Ig producing factory directed against one epitope and based on one cell line, a single clone, or as we’d call it a monoclonal, has been produced.  Each manufacturer’s produced immunoglobulin is different and may produce better or worse results. 

9.       The GP, in Robertson, wants some advice on how to proceed.  What do you tell him?

A multidisciplinary approach would be best:

  • Treatment for the lytic bone lesions (after opinion by radiology): bisphosphonate
  • Assess overall medication and lifestyle to determine overall risk for worsening renal dysfunction (drugs, co-morbidities……always suggest stopping smoking/drinking)
  • Prevention of thrombotic/infective episodes
  • Treatment of any further abnormalities should they arise (hypercalcaemia, anaemia etc.)
  • Specialist referral:
    • Haematoncologist for treatment of MM: UPE , Bone marrow biopsy
    • General surgery for gallstone

10. Is there any relevance for the RUQ/gallstone pain in myeloma specifically?

There are some reports where cholecystitis has presented in MM (mets etc), but it is not a separate entity on its own (such as in POEMS), this is simply the real world where elderly patients have more than one pathology. 


Hemochromatosis

How to remember the side effects of hemochromatosis


Renal tubular acidosis

Two one four, low low more.


A case of Primary hyperparathyroidism and subsequent parathyroidectomy

HOSP # WARD Medical Ward
CONSULTANT   Dr. Jody Rusch DOB/AGE 59 Y Male

Abnormal Result

Hypercalcemia with hypophosphatemia

Presenting Complaint

History

This is a patient with parathyroid adenoma (and resulting longstanding hypercalcemia and hypophosphatemia, which is typical). Adenoma was removed yesterday, acc. to what I can see on a frozen section. Phosphate is dropping even more 0.42 mM (0.78 – 1.42) (on bloods taken this afternoon) and it will likely become significantly lower even.

Examination

Laboratory Investigations

PTH was initially significantly raised, although the renal function was normal. This means that there is likely hypercalcemia due to primary hyperparathyroidism.

PTH & Calcium
Chart drawn by 100lyric (Please, click on the link to understand the diagram)
Primary Hyperparathyroidism
Dx:
• Increased PTH & Ca++ (>10,5mg/dl)
• Low Phospate (
Chart drawn by 100lyric

Other Investigations

Final Diagnosis

Take Home Message

Phosphate supplementation may be quite important as there was longstanding autonomous PTH secretion, depleting stores of phosphate via phosphaturia (also PTH induced). There will likely not be much PTH secretion for some while, hence Vit. D activation will seize and little phosphate absorbed from the GIT due to longstanding lack of phosphate transporters. FGF-23 secretion will also seize and with the lack of PTH, the bone will not resorb and the remodeling process will consume the phosphate in the blood. Most mechanisms to increase phosphate physiologically will likely be dysfunctional at this time. Because he will not adequately absorb phosphate from the GIT (because of failure to activate Vit. D, he may need supplementation of phosphate IV).

Kidneys will however be a bit less phosphaturic (due to lack of PTH), thus he may respond quite well to IV phosphate.


A case of abnormal CSF chemistry results

HOSP # WARD Neurology Ward
CONSULTANT   Jody Rusch DOB/AGE 17 y Female

Abnormal Result

Increased CSF IgG / albumin Index

Decreased CSF Glucose

Presenting Complaint

At this admission, she presented to Groote Schuur Hospital with a history of parasthesias and lower limb weakness. Her symptoms have had a rapid progression to completed paraplegia, with loss of sphincter control over three days. She does not report altered sensorium or alteration in her sleep wake cycle.

History

The patient had two prior episodes of TB and Systemic Lupus Erythematosis, which was diagnosed in 2017. Her presenting symptoms was malar rash, arthralgia, and having positive serological markers.

She has subsequently been diagnosed with class-II nephritis and autoimmune haemolytic anaemia. She was on maintenance immunosuppression regimen of prednisone and azathioprine between 2017-19.

She has had two prior episodes of TB in 2014 and 2018.

She was diagnosed with optic neuritis in October 2019, after she developed visual loss in her left eye with no perception of light. Retrospectively she reports a prior episode of unilateral visual loss in her right eye in February 2019, consistent with an episode of ON. On the basis of her ON she had her immunosuppression escalated to monthly pulses of cyclophosphamide, from November 2019 until march 2020.

She has now developed an acute severe inflammatory longitudinally extensive myelitis, as result of seropositive Neuromyelitis Optica Spectrum Disorder (NMOSD).

Neuromyelitis Optica Spectrum Disorder, or NMOSD, is a rare, lifelong and debilitating autoimmune disease of the central nervous system (CNS), characterized by inflammation in the optic nerve and spinal cord.

Examination

Higher function examination was normal. Cranial nerve examination revealed bilaterally dilated pupils with sluggish responses. Relative afferent pupillary defect (RAPD) was noted in the left eye. Visual acquity is reduced in both eyes, with the left being more severely affected than the right. Fundoscopy showed bilateral disc pallor, no active papillitis. She had no further cranial nerve or bulbar signs. Upper limb motor examination showed paratonia in the right upper limb. The left had mild loss of dexterity and power in her left hand. Reflexes were symmetrical. Power in her lower limbs was reduced with 0/5 power, she would have intermittent involuntary movements to tactile stimuli. She was hypertonic with a triple response. She has a T4 sensory level to light touch and pin prick and has marked joint position sensation loss in both her legs.

The patient was admitted for evaluation of her Myelitis. She was started on high dose methylprednisolone and after 3 days of no response she was started on Plasma exchange. Her spastic paraplegia remains unchanged. She has received pressure care, physiotherapy, OT and bowel regimen in the ward. Given her young age, and aggressive disease (developing an severe acute inflammatory myelopathy while on monthly cyclophosphamide pulse therapy), Department of Internal Medicine hopes she can undergo induction therapy with rituximab (375mg/m2) for her seropositive NMOSD in the hopes of avoiding progressive disability and recovering some voluntary function of her limbs.

Laboratory Investigations

CSF Glucose

CSF glucose was 1.4 mmol/L. This is low. It is unfortunately not known what the plasma glucose was at that time, as it wasn’t sent with a plasma glucose sample at the same time, as one would have hoped. If one assumes the plasma glucose have been normal (3.5-5.5mmol/L) and that CSF glucose’s normal range is 0.6-0.8 x plasma glucose, then this value (0.4 – 0.25 that of serum) is significantly low.

Low CSF glucose is indicative of:

  • bacterial meningitis,
  • mycobacterial infection (TB meningitis),
  • mycoplasmal infection and
  • fungal infection in the CSF.
  • Leucocytes may also decrease CSF glucose – thus it may indicate a disease process rather than only bacterial infection.

CSF Protein

CSF protein of 2.47 g/L (0.15 – 0.45 g/L) is significantly raised. This is indicative of increased permeability of the blood-CSF barrier, most commonly due to inflammatory conditions, but can also be elevated due to:

  • Decreased spinal CSF flow above the sampling level due to:
    • abscess
    • tumor (see also Froin Syndrome)
    • collapsed intervertebral disc
      • These allow for increased equilibration of fluid between CSF and plasma.
  • Immune response within the CSF (intrathecal synthesis of IgG)
  • Destruction of brain tissue releasing proteins directly into CSF.
  • Neonates (term and pre-term) have a higher reference range – up to 1.7 g/L.

CSF Albumin

CSF albumin of 1271 mg/L (100 – 300) is elevated. This value is increased significantly, likely indicating an increase in the permeability of the blood-brain-barrier (severe impairment).

CSF Albumin Index

The CSF Albumin Index was 31.8 mg/g (<9).

CSF albumin is best interpreted in conjunction with the serum albumin. CSF albumin is corrected for leaking of albumin from the serum (thus incorporating the serum albumin concentration). This is called the CSF albumin index (mg/g) = CSF albumin(mg/L) / serum albumin (g/L)

  • <9: intact blood-CSF barrier
  • 9-14: slight impairment
  • 14-30: moderate impairment
  • >30: severe impairment

CSF IgG / Albumin Index

CSF IgG index = 0.86

IgG should under normal situations be almost totally excluded from CSF (blood:CSF ratio of >/= 500:1). Intrathecal production of IgG follows infiltration of the space by B-lymphocytes in demyelinating disorders.

Increase in CSF IgG can however be due to increased permeability form the plasma (dysfunctional barrier), increased plasma IgG concentration or intrathecal production. To correct for the former two, plasma IgG and serum albumin is used in an equation to get the above named index, which tries to isolate CSF IgG for the portion which was produced intrathecally.

The formula is: IgG index= (CSF IgG / Serum IgG) x (Serum Albumin / CSF Albumin). Units of measurement should be similar, at least for serum and CSF respectively.

Reference interval for CSF IgG index is 0.3 – 0.7. Ratios greater than 0.7 indicate increased intrathecal synthesis, as seen in more than 80% of cases of Multiple Sclerosis (MS) and other demyelinating disorders. False elevations occur in traumatic tap and SAH. CSF IgG index is more reliable when the CSF Albumin Index is normal (i.e. when the barrier function is not decreased, but obviously this is rarely the case, as inflammation leads to decreased barrier function).

CSF IgG synthesis rate

153 mg/day

The rate of intrathecal IgG synthesis can be estimated by the empirically derived Tourtellotte’s formula and a synthesis
rate of greater than 8 mg/day is found in most cases of multiple sclerosis. It is a more complex formula, with several constants and probably provides no additional information than the IgG index. (Ref: Tietz 6th Ed.)

Other Investigations

Investigations to this point include the following:

1. MRI brain and spine shows Longitudinal extensive transverse myelitis from the cervical to the lumbar level.

2. FBC and CEU was normal – Neutrophils were normal, lymphocyte count was 0.81.

3. Serologies were ANA, AdsDNA, AntiSm, Anti-Ro Positive. C3 and C4 were normal.

4. HIV, HBV, HCV serology was normal.

5. Serum AQP4 serology positive with a titre of 10

6. CSF: Protein-2.47, Gluc-1.4,P8, L37 R0, IgG index0.87, CLAT, GXP, Culture negative.

7. CD19: 250

8. CXR showed bilateral reticular nodular infiltrate and features of post of TB bronchiectasis

Final Diagnosis

Neuromyelitis Optica Spectrum Disorder

Take Home Message

CSF Glucose

Using a ratio of CSF to serum

glucose ratio of less than 0.4, an 80% sensitivity and 98%

specificity was found for distinguishing bacterial (n = 119)

versus aseptic cases (n = 97) of meningitis.

Donald P, Malan H, van der Walt A. Simultaneous
determination of cerebrospinal fluid glucose and blood
glucose concentrations in the diagnosis of bacterial
meningitis. J Pediatr 1983;103:3. – Referenced from Tietz Textbook of Clinical Chemistry 6th ed.

Recovery from meningitis results in recovery of glucose before CSF cell counts and Total Protein.

CSF glucose is typically normal in CSF viral infections, exceptions may include: Meningoencephalitis with Mumps, EV, HSV, HZV.

Leucocytes may also decrease CSF glucose – thus it may indicate a disease process rather than only bacterial infection.

Ratio of CSF:serum glucose has limited utility in neonates and in pts. with hyperglycemia.

CSF glucose <1.0 mmol/L is highly indicative of bacterial meningitis.

If intellectual disability, seizures and motor impairment is present along with low ratio, think of GLUT-1 transporter deficiency – then measure CSF lactate.

CSF Chemistry

As described above

Correcting total protein for Traumatic tap

The presence of CSF bleeding results in approximately 0.010 g of protein / L per 10^6 RBCs / L


The Vitamin D cutoff conundrum

Introduction

Vitamin D status is considered important for calcium balance and bone health as 1,25 (OH)2 vitamin D (calcitriol) promotes calcium absorption from the gut and has pleiotropic effects in bone. Vitamin D deficiency leads to hypocalcaemia and osteomalacia or rickets in adults and children respectively.

Vitamin D status was also brought under the spotlight owing to an apparent association with cardiovascular health and several other chronic disorders. These associations were noted in animal studies but the findings were not mirrored in humans. Vitamin D sufficiency or insufficiency is determined using quantitative analytical techniques, with results interpreted against statistically-determined cutoffs.

The Controversies

Controversies exist due to the analytical methods as well as the methods to determine these decision limits. The analytical methods available to quantify vitamin D include immunoassays and HPLC or LC-MS/MS methods. The majority of labs use immunoassays to measure 25(OH) vitamin D (calcidiol), and a smaller group also measure calcitriol by immunoassay. Calcidiol occurs at higher concentrations in the serum and, in most cases, it better reflects the vitamin status than calcitriol, as 1-alpha-hydroxylase activity is modulated according to calcitriol and calcium status.

However, immunoassays are non-specific regarding metabolites of vitamin D and therefore results of calcidiol and calcitriol measurement may not be accurate due to cross-reactivity. LC-MS/MS is a much more accurate methodology to measure both calcidiol and calcitriol as well as other metabolites of interest, such as 24,25(OH)2 vitamin D. One controversial point is, therefore, whether or not calcidiol and calcitriol measurements by immunoassay are accurate.

The second controversy lies in the determination of the decision limits for vitamin D repletion, sufficiency and insufficiency. Currently, there are two major sets of decision limits to choose from. The first were determined and recommended by the Endocrine Society based on recommended daily allowances (RDA) for the vitamin. It is argued that the concept of the RDA is misinterpreted and the methods for setting the RDA not understood. These decision limits are high, and by these limits some 50% of most populations are diagnosed with vitamin D insufficiency. This is also dangerous, as replacement of vitamin D may lead to hypervitaminosis D, which is not benign and may in fact increase the risk of falls and fractures. Another consequence is the demand for testing vitamin D levels is very high, which is expensive for healthcare funders or individuals, with questionable health benefits.

The other popular set of decision limits were determined based on the risk of falls and fractures (Institute of Medicine) – a more functional approach. The result of using these limits is that the majority of the population will fall into the vitamin D sufficient or replete groups, and only individuals at high risk will have their status checked and/or monitored and receive supplementation as necessary. This is a more cost- and clinically-effective approach, but is yet to be globally adopted.

Vitamin D and Cardiovascular Disease: Controversy Unresolved ...

The final point to be made is perhaps what drives the interest in vitamin D status, and it may be suggested that it is the reagents and pharmaceutical industry as they stand to gain from increased testing and demand for supplements.


Wilson’s disease

Mutation in the Wilson disease protein (ATP7B) gene, a protein transporting excess copper to bile.

Copper build-up in the brain and liver mostly, which can cause fulminant liver failure.

Other organs

Eyes: Kayser-Fleischer rings

Kayser–Fleischer ring – Pathognomonic sign of Wilson’s disease.

Kidney: RTA type 2

Heart: Cardiomyopathy

Hormones: Hypoparathyroidism

Diagnosis

  1. Serum and urine copper:

Urine copper Interpretation:
Normal dU copper (24 hr) ………………… 15-36 ug/24hr
Indicative of Wilson’s Disease …………… 40-100 ug/24hr
(Need to confirm with additional test)
Confirms Wilson’s Disease ……………….. >100 ug/24hr

Serum Copper will paradoxically be low. This is because ceruloplasmin (copper-binding protein) is low in 80-95% of patients with Wilson’s disease.

2. Ceruloplasmin low (remember it’s an acute phase protein)

3. Liver biopsy

4. Genetic sequencing of the ATP7B gene.

Treatment

Low Copper diet (avoid copper cutlery)

Penicillamine (Cuprimine – not available in South Africa) binds Cu by chelation and excretion in urine (but causes drug-induced lupus and Myastenia Gravis in 20%)

Trientine also chelates.

Zinc stimulates metallothionein, a protein in gut cells that binds copper and prevents their absorption and transport to the liver. As soon as urine Cu excretion is in normal limits, patients will go on to Zn therapy.

Asymptomatic pts. (by family gene screens) are treated, because copper accumulation will cause problems later. Usually Zn is used.

Images are all from Wikipedia


PTH Summary

Dr. Jody Rusch’s simplistic explanation of PTH and its measurement

n-truncated are deficient in the first few aa’s (7-84) – hence biologically inactive.

1-11 aa sequence is necessary for function.

Different assays:

  • Intact PTH measurements: 7-84 and 1-84
  • Bioactive PTH: 1-84
  • CAP assay: cAMP inducible PTH. This assay determines the biologically active PTH by its ability to induce cAMP.
  • PTHrP assays and PTH assays are exclusive to each other by design.