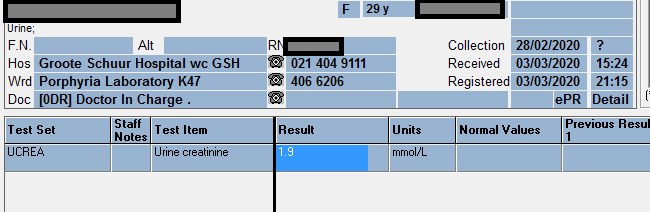
Excessive amino acids in the Urine
| HOSP # | WARD | A1 Paediatric Ward – Grey’s Hospital | |
| CONSULTANT | Prof. George van der Watt | DOB/AGE | 27 day old Female neonate |
Abnormal Result
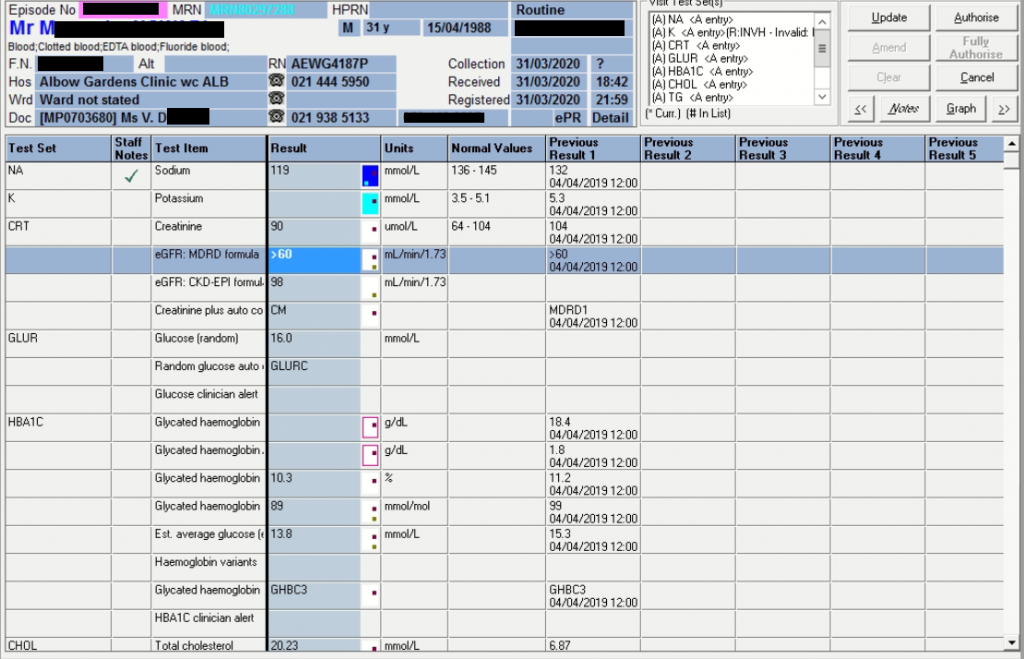
Sodium 186mmol/L
Presenting Complaint
The neonate was taken to the Emergency Department due to seizures.
History
Unfortunately the attending clinician at Greys hospital did not have much of the history.
There was no history of diarrhoea according to what she remembered.
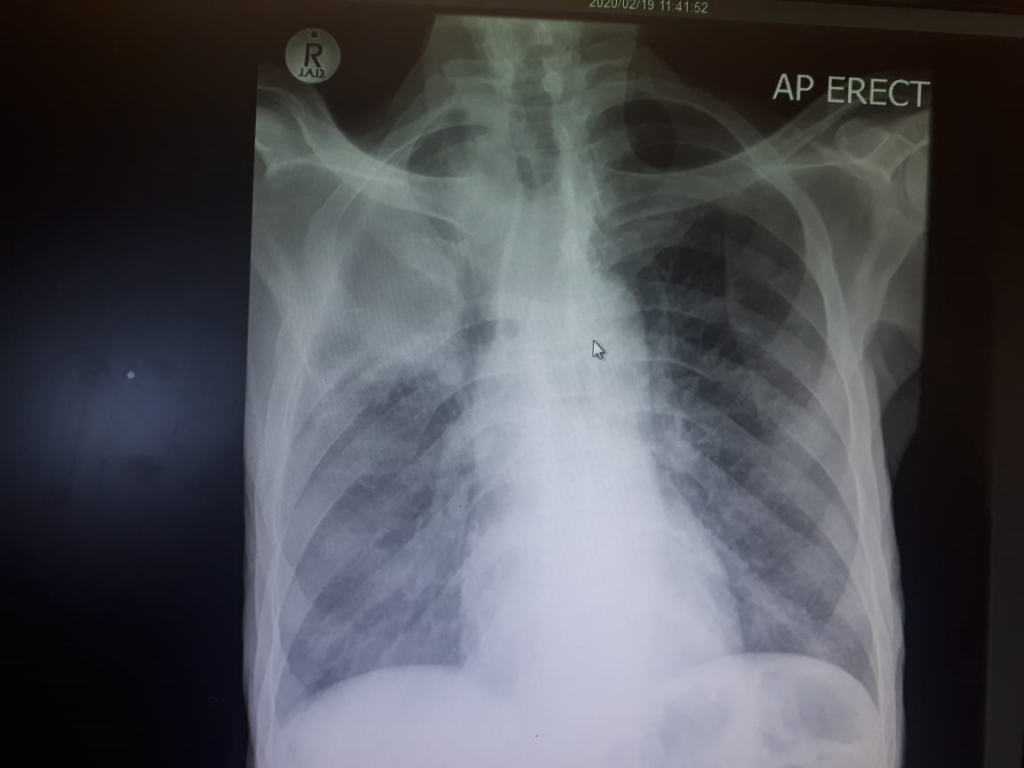
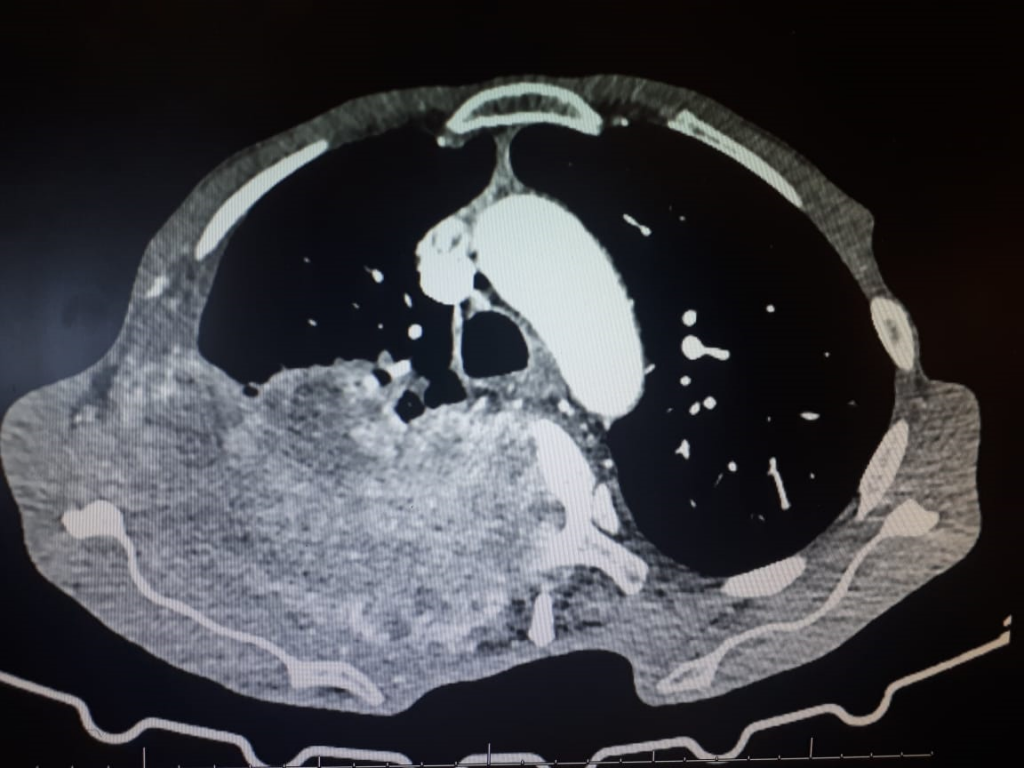
Examination
Patient was severely dehydrated clinically.
Later the patient presented with edema, signs and symptoms of nephropathy and biochemical changes in keeping with liver failure.
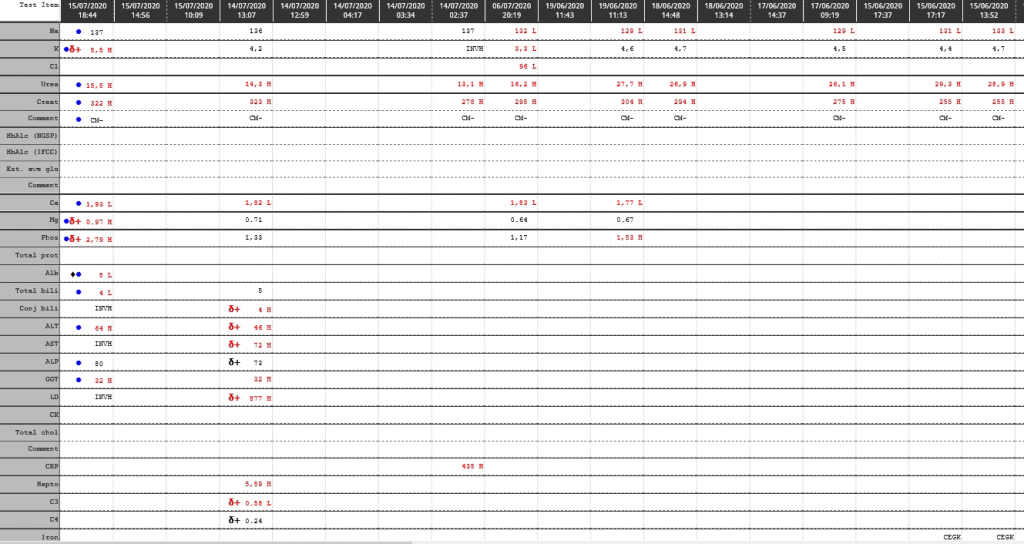
Laboratory Investigations
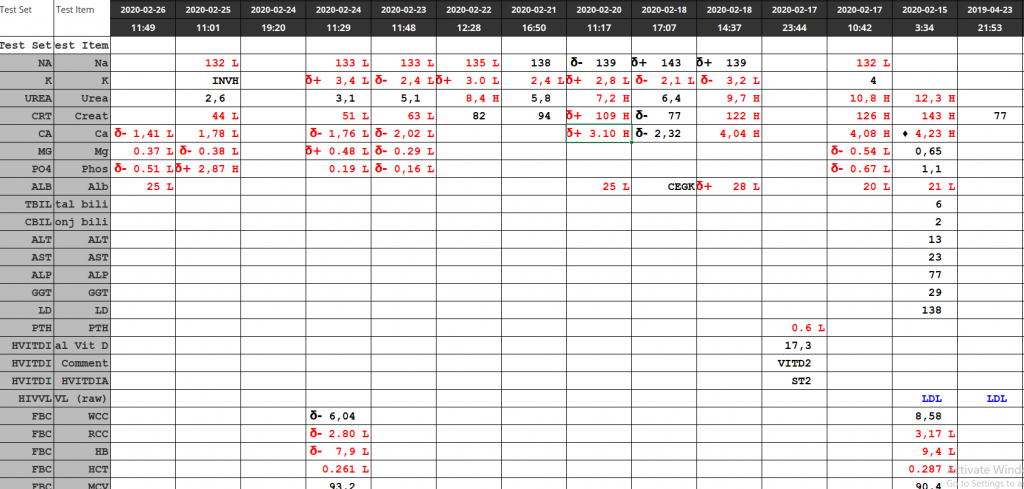
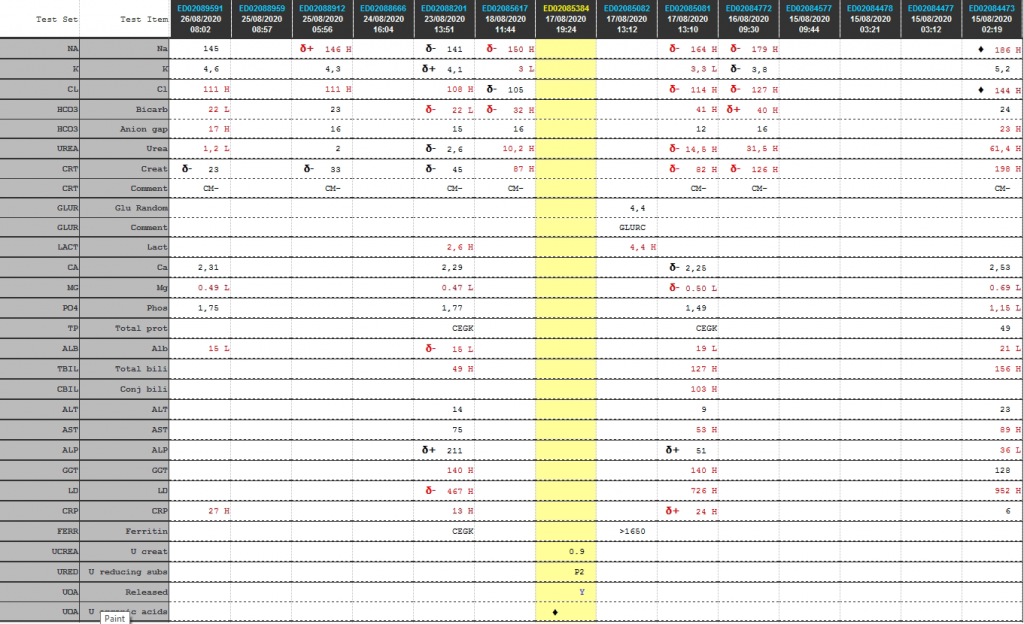
Cumulative laboratory history
| Test | 26/08/2020 | 25/08/2020 | 23/08/2020 | 18/08/2020 | 17/08/2020 | 16/08/2020 | 15/08/2020 |
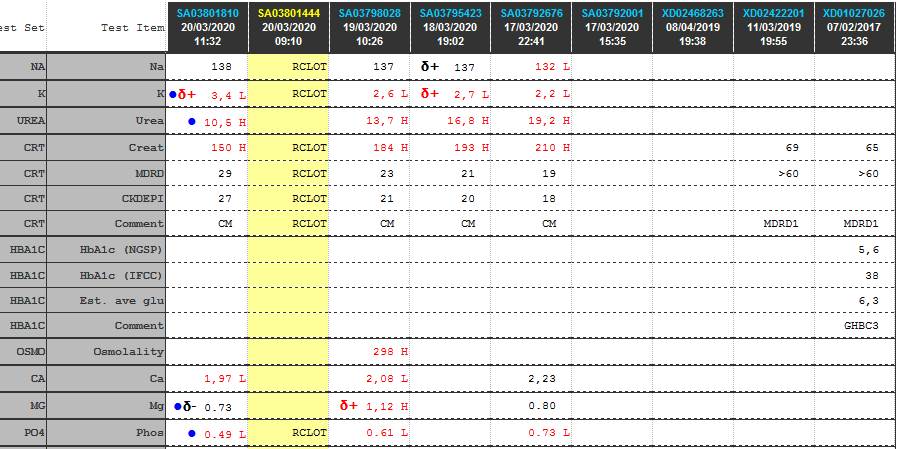
| Na | 145 | δ+ 146 H | δ- 141 | δ- 150 H | δ- 164 H | δ- 179 H | ♦ 186 H |
| K | 4,6 | 4,3 | δ+ 4,1 | 3 L | 3,3 L | δ- 3,8 | 5,2 |
| Cl | 111 H | 111 H | 108 H | δ- 105 | δ- 114 H | δ- 127 H | ♦ 144 H |
| Bicarb | 22 L | 23 | δ- 22 L | δ- 32 H | 41 H | δ+ 40 H | 24 |
| Anion gap | 17 H | 16 | 15 | 16 | 12 | 16 | 23 H |
| Urea | 1,2 L | 2 | δ- 2,6 | 10,2 H | δ- 14,5 H | 31,5 H | 61,4 H |
| Creat | δ- 23 | δ- 33 | δ- 45 | 87 H | δ- 82 H | δ- 126 H | 198 H |
| Glu Random | 4,4 | ||||||
| Lactate | 2,6 H | 4,4 H | |||||
| Ca | 2,31 | 2,29 | δ- 2,25 | 2,53 | |||
| Mg | 0.49 L | 0.47 L | δ- 0.50 L | 0.69 L | |||
| Phos | 1,75 | 1,77 | 1,49 | 1,15 L | |||
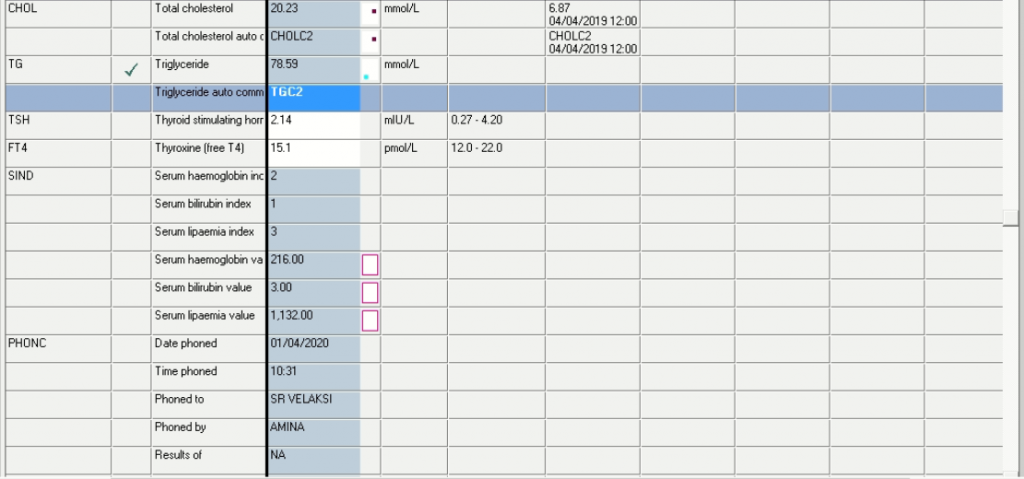
| Total prot | CEGK | CEGK | 49 | ||||
| Alb | 15 L | δ- 15 L | 19 L | 21 L | |||
| Total bili | 49 H | 127 H | 156 H | ||||
| Conj bili | 103 H | ||||||
| ALT | 14 | 9 | 23 | ||||
| AST | 75 | 53 H | 89 H | ||||
| ALP | δ+ 211 | δ+ 51 | 36 L | ||||
| GGT | 140 H | 140 H | 128 | ||||
| LD | δ- 467 H | 726 H | 952 H | ||||
| CRP | 27 H | 13 H | δ+ 24 H | 6 | |||
| Ferritin | CEGK | >1650 |
Urine reducing subs (screen)
Positive ++
Urine reducing substance ID (chromatography):
TLC shows the presence of trace glucose only.
Urine Amino Acid Analysis


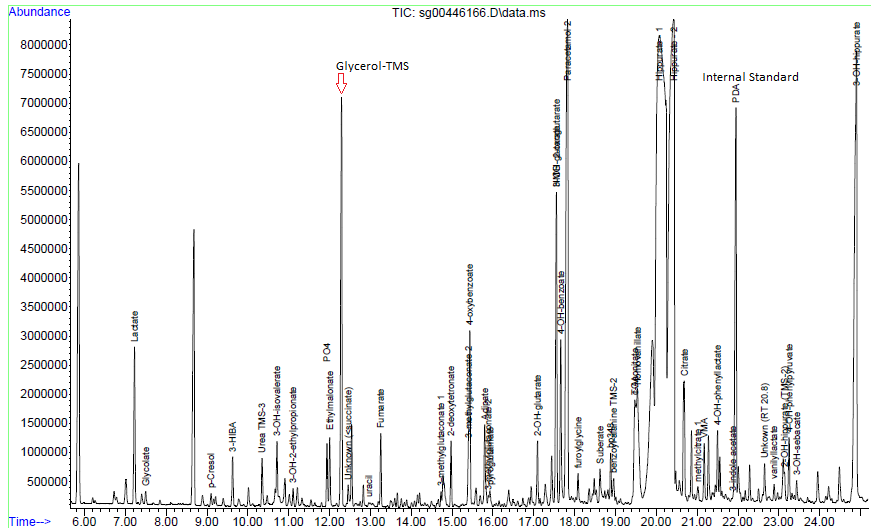
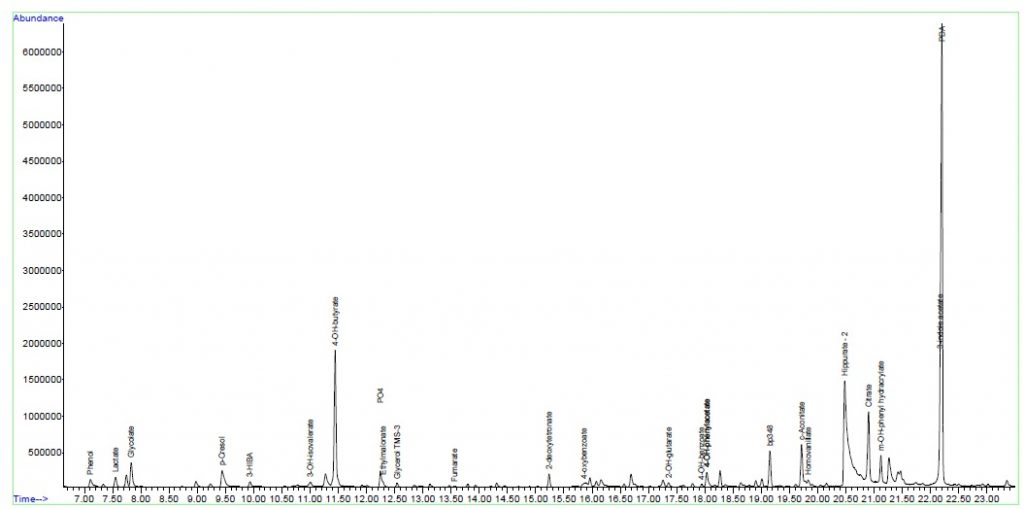
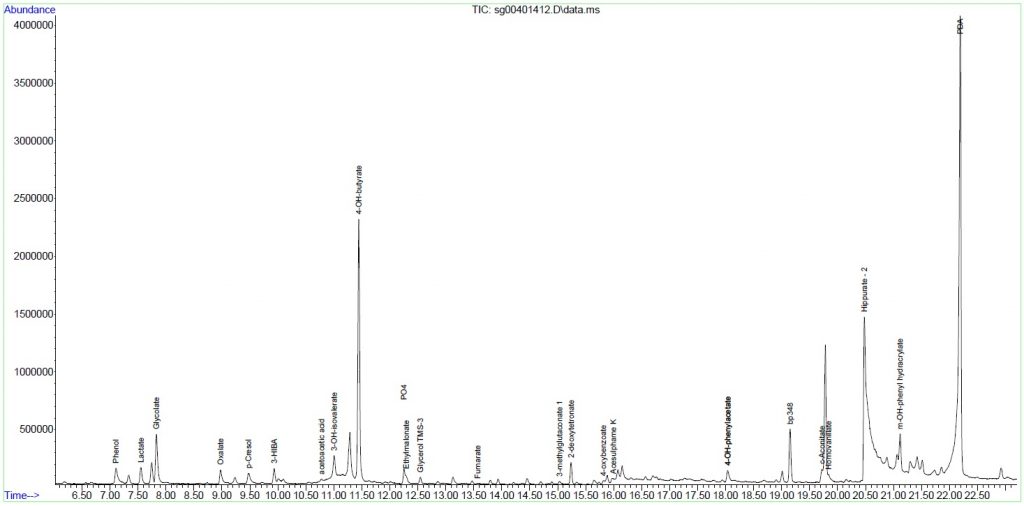
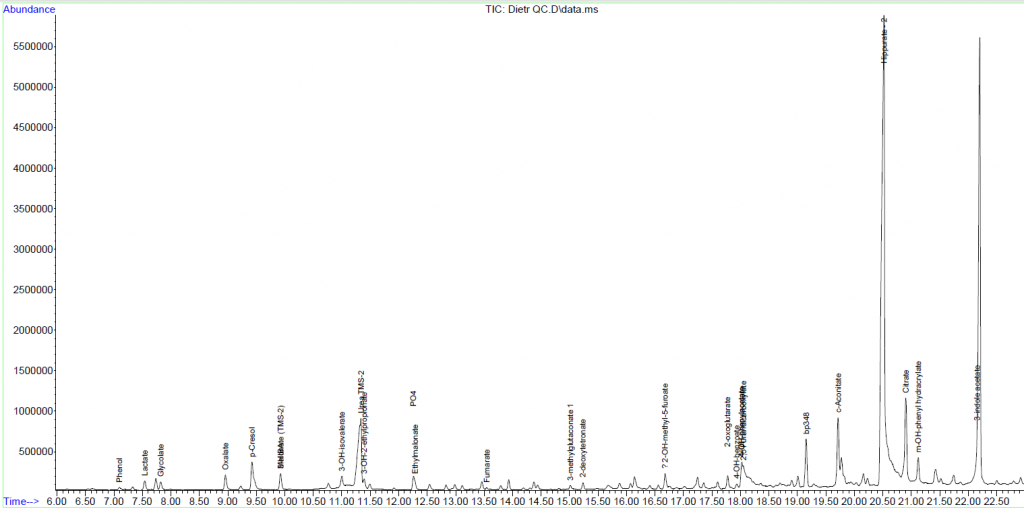
Urine organic acids
        Interpretation:
        Urine organic acid analysis by GCMS demonstrates elevation of the liver markers
        4-OH phenyllactate and 4-OH-phenylpyruvate together with lactaturia.
        Succinylacetone, a marker for tyrosinaemia type 1 is absent. These changes
        indicate underlying hepatic dysfunction with lactataemia but are non-specific
        for an IMD per se. Rare forms of lactataemia include defects in pyruvate
        metabolism (gluconeogenic defects such as glycogen storage disease type 1,
        pyruvate dehydrogenase deficiency and thiamine deficiency). In these disorders
        the lactate/pyruvate ratio is normal despite lactataemia. In pyruvate
        dehydrogenase deficiency the CSF/Plasma lactate ratio is typically >2. Please
        note that routine metabolic screening does not exclude galactosaemia. If
        galactosaemia is suspected this should be screened for by measuring red cell
        GALT activity in unspun heparin whole blood or by screening for the common
        African S135L mutation in Black South African patients. As part of our
        gatekeeping policy to limit unnecessary testing, routine metabolic screening at
        Red Cross Children's Hospital consists only of urine organic and amino acid
        analysis. Additional tests must be requested separately based on the working
        differential diagnosis and routine screening results. Relevant legible clinical
        information also aids significantly in interpreting metabolic profiles.
Other Investigations
Urine dipstick:
Blood 3+
Protein: Trace
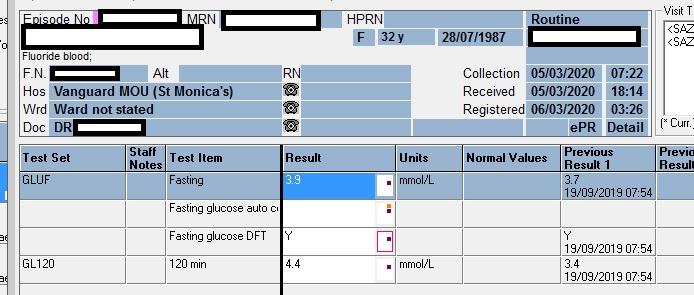
Glucose (by glucose oxidase) ++/+++ 28 – 55 mmol/L (hence this is most likely the predominant reducing sugar – as suggested by Prof David). This is an interesting finding since the random glucose in the ward the same day was 4.4 mmol/L. Hence two possible theories: likely either severe tubular injury or, when the child had convulsions they gave a dextrose infusion which increased the plasma glucose above the renal threshold.
pH >8.5
Nitrites: Not present
Leucocytes: Not present
Urobilirubin: Trace
Bilirubin: Not present
Final Diagnosis
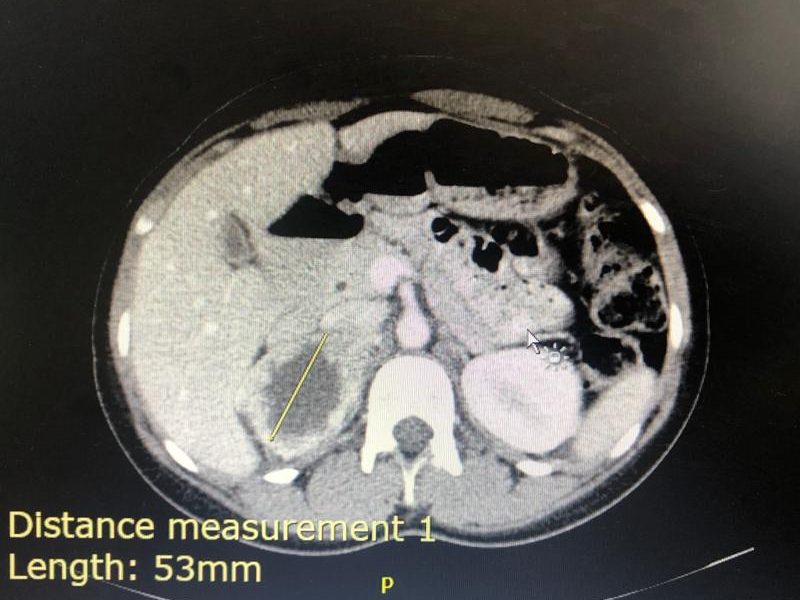
Severe dehydration with acute kidney injury (pre-renal origin) is the most likely cause of the presentation of seizures.
Take Home Message
Dehydration is a common cause of pre-renal acute kidney injury
My thoughts initially, was that the urine amino acid screening by GCMS demonstrated a heavy generalized aminoaciduria indicative of renal tubulopathy and that cystinosis should be considered as this is the most common inheritable cause of renal tubulopathy in South Africa. However, this was later decided to be changed to rather and “evolving tubulopathy” clinical picture, as shown in the two examples below.

Fanconi syndrome — Generalized proximal tubular dysfunction, referred to as Fanconi syndrome, is characterized by phosphaturia, renal glucosuria (glucosuria with a normal plasma glucose concentration), aminoaciduria, tubular proteinuria, and proximal RTA.
The etiology of Fanconi syndrome includes inherited diseases or acquired causes [Source: Up-to-date]:
Genetic conditions associated with Fanconi syndrome include the following:
- Dent disease (X-linked recessive nephrolithiasis)
- Cystinosis
- Tyrosinemia type 1
- Galactosemia
- Wilson disease
- Lowe oculocerebrorenal syndrome, also referred to as Lowe syndrome
- Hereditary fructose intolerance
- Mitochondrial myopathies
Acquired causes of Fanconi syndrome include:
- Drugs – Medication associated with Fanconi syndrome include
- aminoglycosides
- cisplatin
- ifosfamide
- valproic acid
- deferasirox
- Heavy metals
- lead
- mercury
- cadmium
The fact that the urine dipstick was positive for glucose, suggests that either the acute kidney injury is the source of glucosuria or the patient was treated with high dose dextrose, causing the plasma glucose to overwhelm the tubular threshold for glucose transport.