Section 7.8 – COVID OTL Dashboard
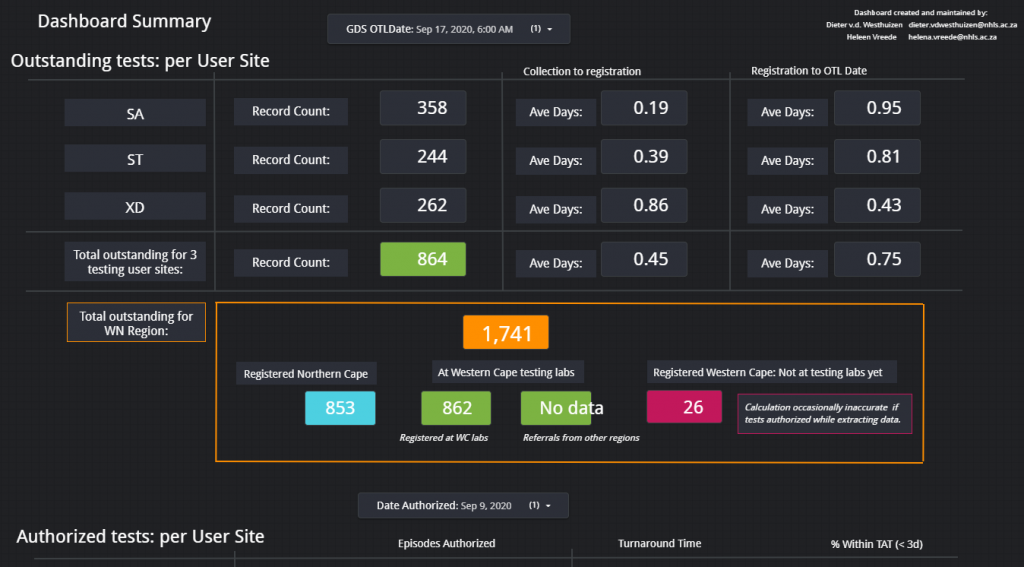
A dashboard was created to visually represent the COVID outstanding test list for our province for COVID outstanding PCR tests. This dashboard has been requested by the area manager of the Western Cape and various others on the Virology Expert Committee. Even though not a task primarily assigned to chemical pathologists, since I have an interest in data science, I tried to help. The end result was a dashboard which is updated every morning at 06h00 and every evening at 18h00 with a few JavaScript scripts running each day, updating three databases on the backend along with automated data extractions being done from TrakCare every morning and evening at a predefined time.
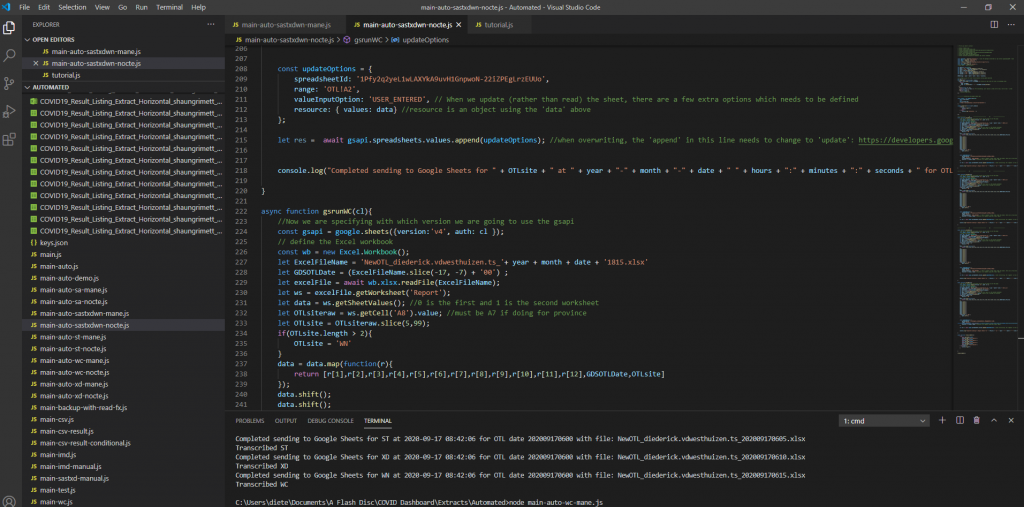
This dashboard was used (and likely still are being used) especially by the virologists at Groote Schuur Hospital to track the progress of outstanding COVID PCR tests and it can also be used to show possible bottlenecks in pre-analytical sample issues if tests are already registered before being sent to any of our laboratories in the Western Cape.
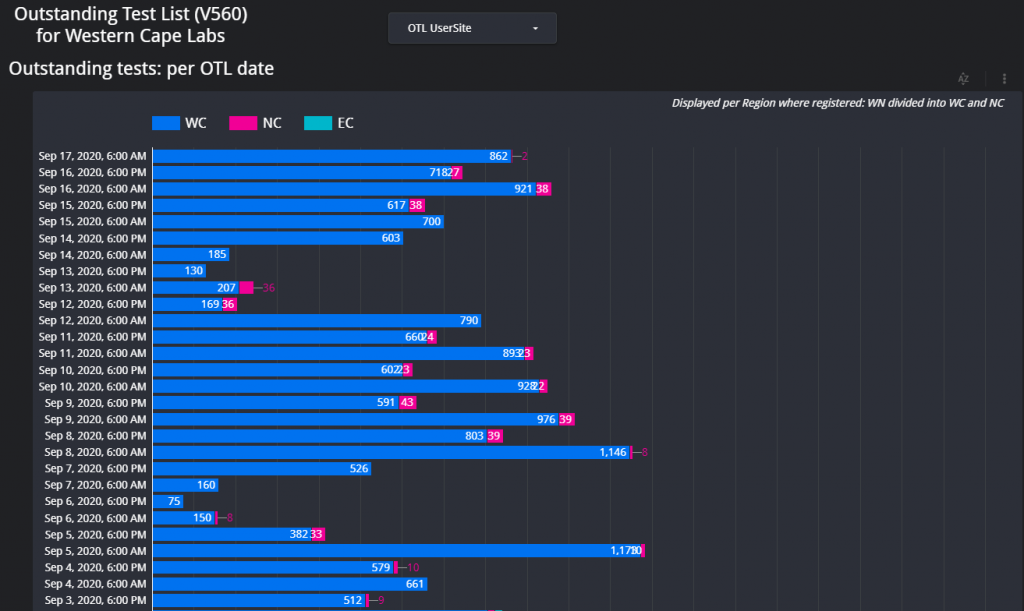
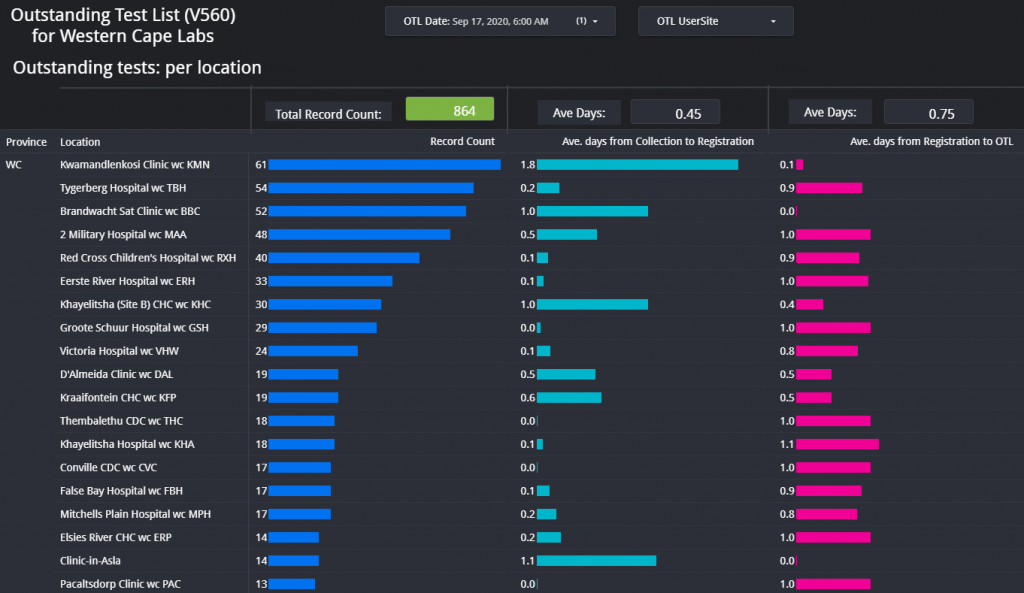
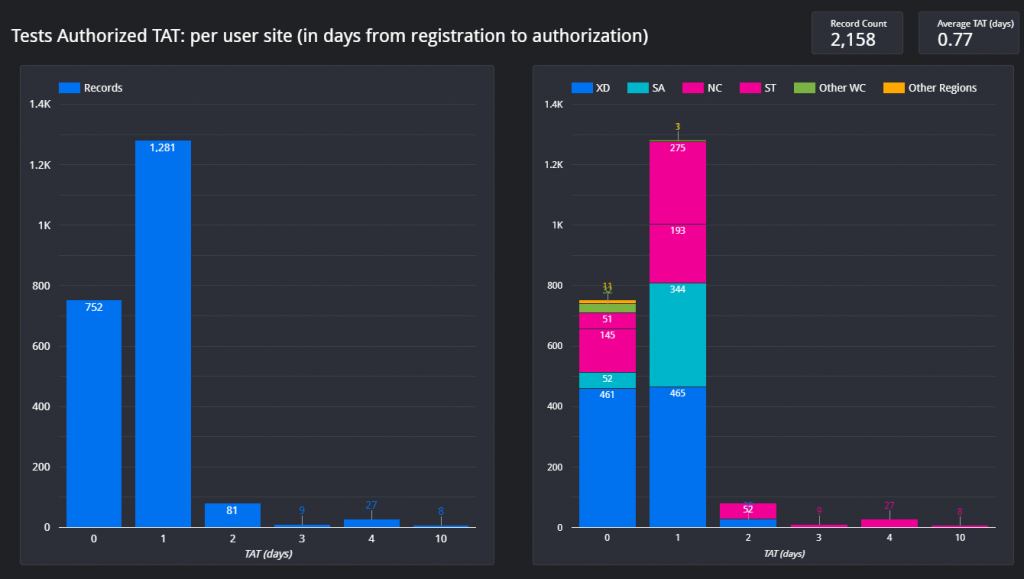
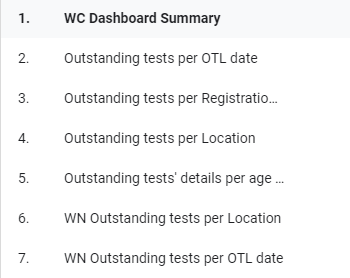
The dashboard consists of a few pages:
https://datastudio.google.com/embed/reporting/aeafe888-d10f-4959-b1f3-928556abd6f6/page/LMPXB