A dashboard was created to visually represent the COVID outstanding test list for our province for COVID outstanding PCR tests. This dashboard has been requested by the area manager of the Western Cape and various others on the Virology Expert Committee. Even though not a task primarily assigned to chemical pathologists, since I have an interest in data science, I tried to help. The end result was a dashboard which is updated every morning at 06h00 and every evening at 18h00 with a few JavaScript scripts running each day, updating three databases on the backend along with automated data extractions being done from TrakCare every morning and evening at a predefined time.
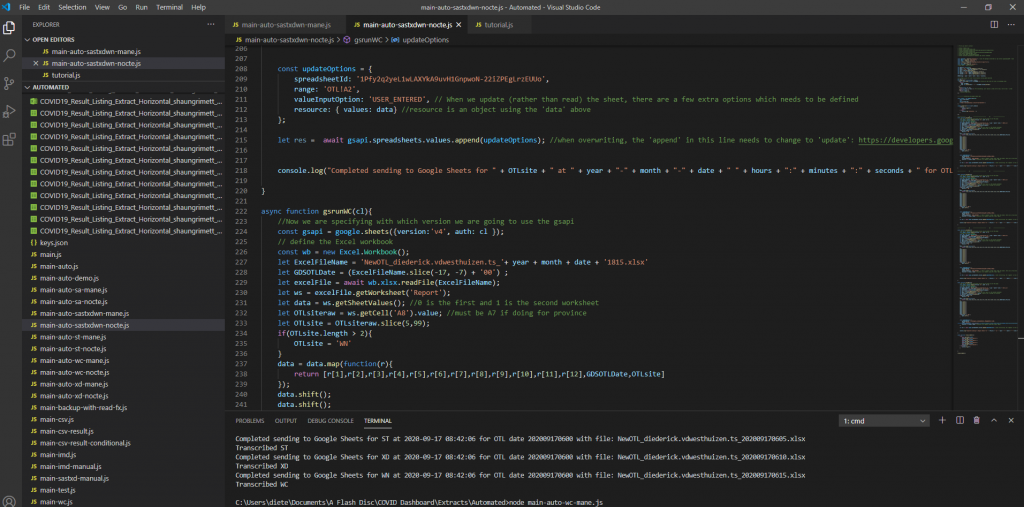
Screenshot 1 – Illustration of the JavaScript code to read the extracted Excel (or CSV) files and transcribing them to a Google Sheets database.
This dashboard was used (and likely still are being used) especially by the virologists at Groote Schuur Hospital to track the progress of outstanding COVID PCR tests and it can also be used to show possible bottlenecks in pre-analytical sample issues if tests are already registered before being sent to any of our laboratories in the Western Cape.
Figure 1 – Screenshot of the Dashboard. Follow the link above to view.Figure 2 – Example of the layout of the page which shows the total count of items on the respective outstanding test lists for each respective data for the Western Cape.Figure 3 – Outstanding tests summary by location. This page is especially helpful if the delay / outstanding tests from a specific hospital or clinic needs to be visualized in comparison with other locations (hospitals / clinics).Figure 4 – Illustration of the turnaround time met by a certain count of samples per each respective user site for one day.
Section 7.7 – Laboratory Management
Presentations attended related to laboratory management:
PathCape 2018
Accreditation, Quality and Leadership – Prof A Zemlin – PathCape 17 August 2018
Error Free Lab Work: Is it an achievable target? – Prof Yenice (Turkey) – PathCape 17 August 2018
P4P (pay for performance) in Laboratory Medicine – Dr Orth (Germany) – PathCape 17 August 2018
Laboratory management course – University of Stellenbosch 02-05 November 2020
The laboratory management course which I attended through Stellenbosch University was an exciting experience. Although during COVID times, it wasn’t necessarily a trip to Stellenbosch where one could have a glas of wine at a local wine farm afterwards, but nonetheless it was an amazing experience. I have made friends with colleagues in other Pathology disciplines remotely and we needed to prepare a Strategic Business Plan and present it at the end of the course.
All talks attended were focussed on laboratory management. The skills learnt during this course will likely still bring much joy and productivity into my work life in future and the tools learnt to properly manage a laboratory are of enormous value.
There were tasks from as simple as a left-right quizz, to a QC workshop for our chemical pathology registrars with Levy-Jennings chart interpretation and the lot. Some of the most enjoyable topics for me were: Adding value to lab medicine, a topic often focussed on by Prof Annie Zemlin, effective laboratory leadership, focussed on by Prof Rajiv Erasmus, an effective laboratory leader in Chemical Pathology and the topic on Risk management by Prof Preiser. Together these topics which were presented (see below) made up an astounding course which brought together a few aspects rarely covered by other lecturers or even reading material elsewhere. This is what makes this course a must for future laboratory leaders.
Day 1 – 02 November 2020 Talk 1 – Leadership Skills For Effective Laboratory Management – Mandela’s Lessons – Prof RT Erasmus Talk 2 – Laboratory Organization – Best Practice – Dr Z Chapanduka Talk 3 – Ethical Leadership – Prof RT Erasmus Talk 4 – Strategy And Leadership Strategic And Goal Planning For Effective Laboratory Management – Prof RT Erasmus Talk 5 – Budget And Introduction Of New Tests – Prof AE Zemlin Talk 6 – Laboratory Safety – Prof TS Pillay
Day2 – 03 November 2020 Talk 1 – Leading And Managing Change In The Laboratory – Prof G van Zyl Talk 2 – Leadership And Diversity – Prof AE Zemlin Talk 3 – Preventing And Managing Conflict In The Laboratory – Prof Schneider Talk 4 – Risk Management In The Diagnostic Laboratory – Prof W Preiser Talk 5 – POPIA For The Healthcare Professional – Dr C Swanepoel Talk 6 – EBLM and Audit – Dr T Jalavu
Day3 – 04 November 2020 Talk 1 – Use Of Quality Management Tools To Assess And Improve Quality – Prof A Whitelaw Talk 2 – Iso 15189 And Preparing The Lab For Accreditation – Prof AE Zemlin Talk 3 – Non-Conformances & Document Control – Dr AA Khine Talk 4.1 – Lean Management And Quality – Dr AA Khine Talk 4.2 – Six Sigma Approach To Quality – Dr AA Khine Talk 5 – Managing A POCT Service – Prof A Whitelaw Talk 6 – Method Validation – Dr M Hoffmann Talk 7 – Extra-Analytical Errors – Dr E Kruger
Day4 – 05 November 2020 Talk 1 – Harmonization, Standardization And Traceability – Dr T Jalavu Talk 2 – Electronic Gatekeeping – Dr H Vreede Talk 3 – Medico-legal aspects of laboratory practice and maintenance of the chain of evidence – Prof J Dempers Talk 4 – Autoverification – Dr H Vreede Talk 5 – Demand Management – Prof AE Zemlin Talk 6 – Uncertainty Of Measurement – Dr E Kruger
Section 7.7 – Laboratory Business Plan Presentation
At the Laboratory Management course, attended virtually at the University of Stellenbosch, our task was to give a presentation of our business plan.
The task was as follows:
You are the head of an accredited academic pathology laboratory (you have to annually sustain its accreditation status) at a large 1000 bed teaching hospital in one of the developing countries in Africa. You are in charge of providing laboratory tests to a population of 3 million people who are spread out (large urban and rural pockets). In addition to providing a comprehensive tertiary quality service you also teach undergraduate students and train postgraduate specialists. One of your other duties is to carry out research and ensure research outputs that are of international standard as well as supervise postgraduate students and apply for large grants to support these projects. Your academic laboratory closely works with the medical faculty and the Medical Research Council of your country. There are 2 private pathology laboratories who also compete with your laboratory for proving a service. You are also expected to provide community services and cover the province in which your laboratory is located. As part of the 5 year service and academic plan you have been asked to develop a strategic plan for your department for the next five years. Your team will present this plan for discussion and approval You are divided into 5 groups. Each group will make a presentation at the end of the course on Thursday afternoon (05/11/2020) and your presentation will be assessed. Each presentation will last for 20 mins and will take the form of a group presentation in which all members of your group will present various aspects of the strategic plan. Group discussion time must be used for this activity.
GROUP ASSIGNMENT, DISCUSSION AND FINAL PRESENTATION
We were a multi-disciplinary team, consisting of 2 Chemical Pathology registrars, a Hematology registrar as well as a Histopathology registrar. This task was taken on with great enthusiasm and the presentation received positive feedback. See downloadable pdf version of the presentation below:
Various auditorial and management tasks has been performed in the laboratory throughout my 4 years. These include but are not limited to:
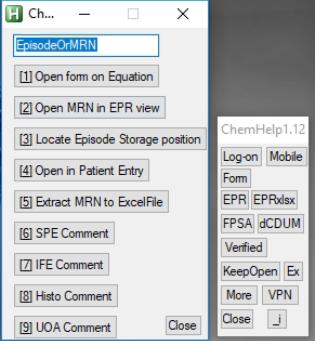
ChemHelp – A script (program) which helps reviewers with the signing of blood results. It consists of various hotkeys, hotstrings and a few buttons which has evolved as our “right hand” when reviewing blood results at Groote Schuur Hospital NHLS. On face value it appears as a small petit application which runs alongside TrakCare, but the time saving is likely to be quite significant. This will likely be a nice additional audit – another project which could be taken on later. Unfortunately the descriptions of the functions of this script goes beyond the scope of this section, so please refer to Section 9.2.4 – ChemHelp SOP or visit: github.com/dietervdwes/ChemHelp (hyperlinks unfortunately are non-functional in a combined and printed PDF).
Screenshot of ChemHelp 1.12 with the “More” menu function expanded.
2. Data extraction tasks for projects and audits – Apart from being involved in an audit in our laboratory, I have been involved in assisting with data extraction via TrakCare’s Results Listing interface. Additionally, I have written a JavaScript extraction tool which has been used (and are being used) in a few studies currently. I have also incorporated into ChemHelp (see above) an automation tool for data extraction via TrakCare’s Results Listing interface. See Section 9.2.
3. Management and advisement of some pre-analytical aspects are sometimes required. As registrars we need to advise and help improve pre-analytical staff’s knowledge through assistance with routine test request queries. We also have a programme where the registrar’s do what we call a “Tech Talk”. These are mainly aimed at technologists but I have also given a talk to an audience including pre-analytical staff on aspects like sample delay, hemolysis and the effect thereof on HIL-indices.
4. Setting up of a referral system – I have set up a referral system for urine steroid profiles in our laboratory. I was involved in identifying the referral lab, setting up the billing codes on TrakCare, with Dr. Heleen Vreede and setting up the canned comments for recording of the results. Invoicing also caused some problems which we had sort out.
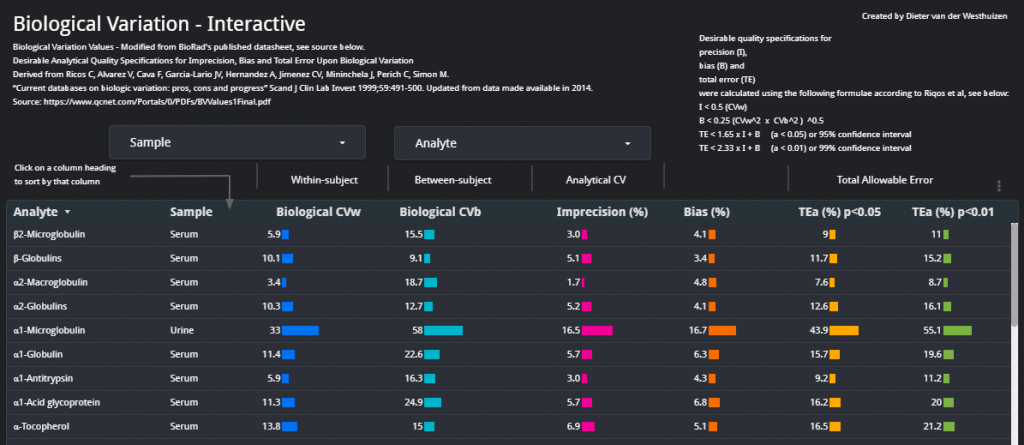
5. TEa Dashboard – I have taken the data from the Riqos et al. study on Biological Variation (updated in 2014) and made an interactive dashboard which we can use when reviewing QC. This dashboard assists in quickly viewing the data visually in a quick-to-access Google Data Studio Dashboard.
Screenshot of the TEa Dashboard – view it at TEa Dashboard ( tinyurl.com/biorad-tae ).
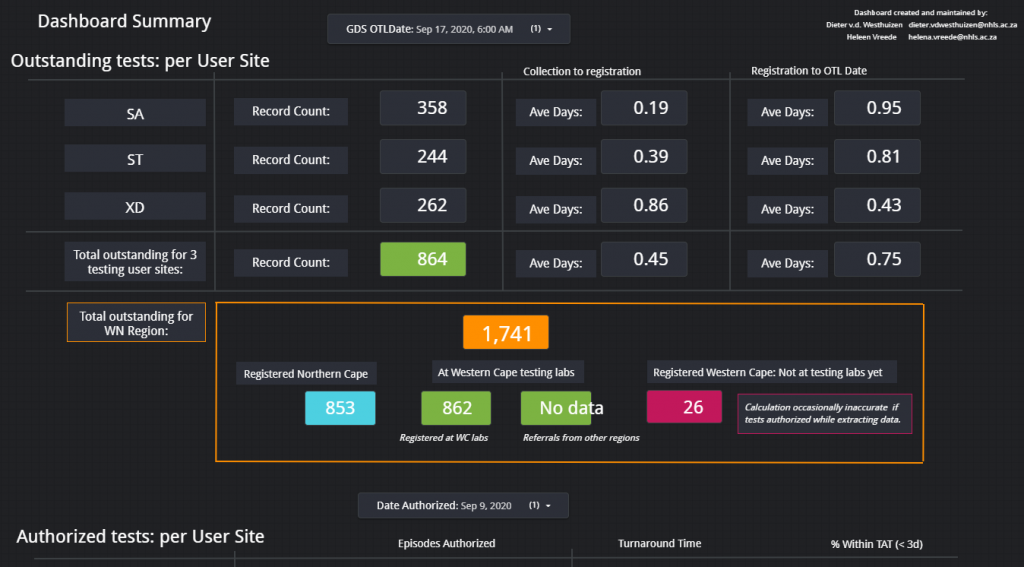
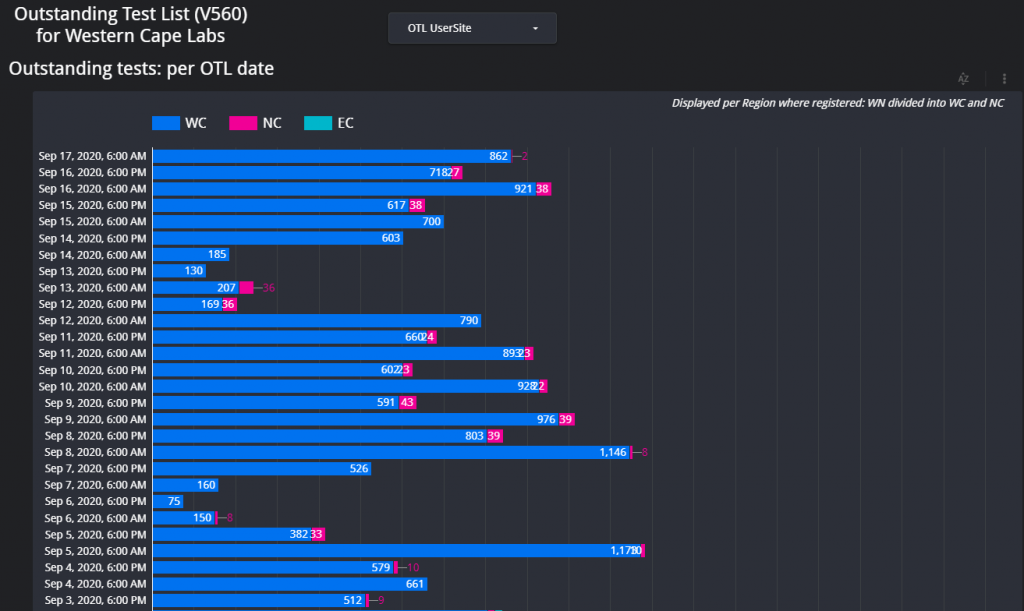
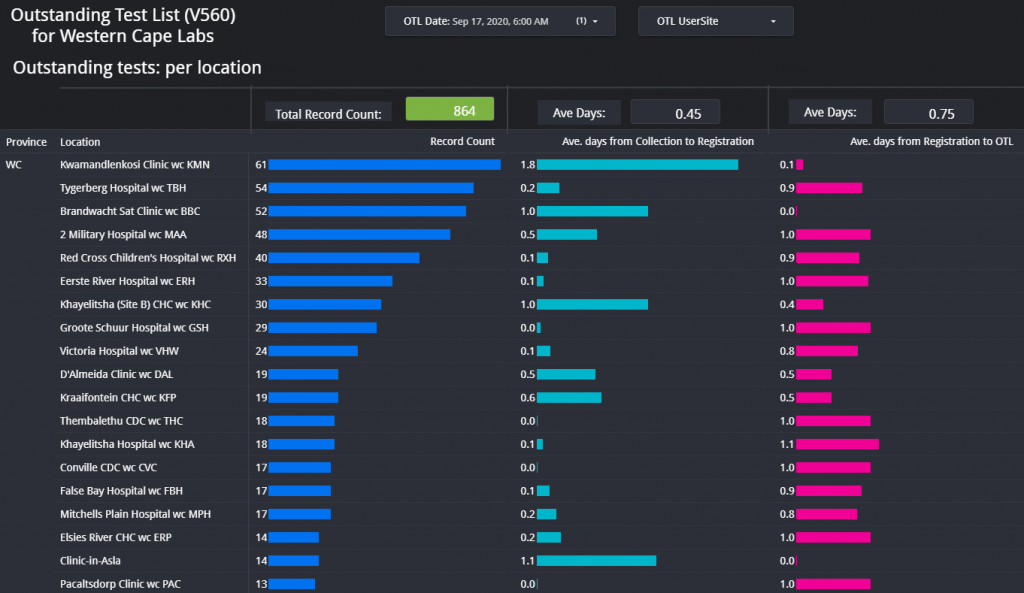
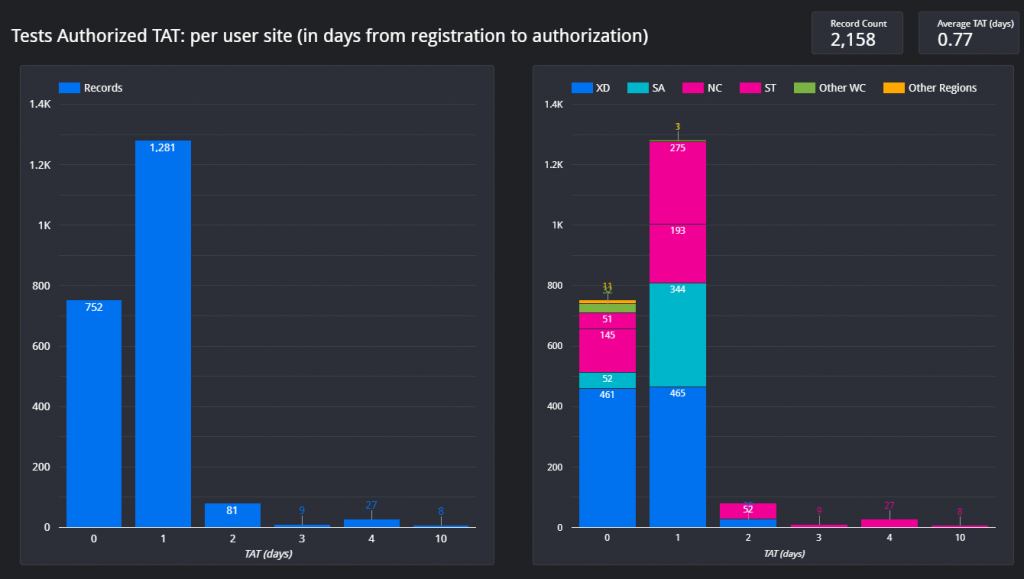
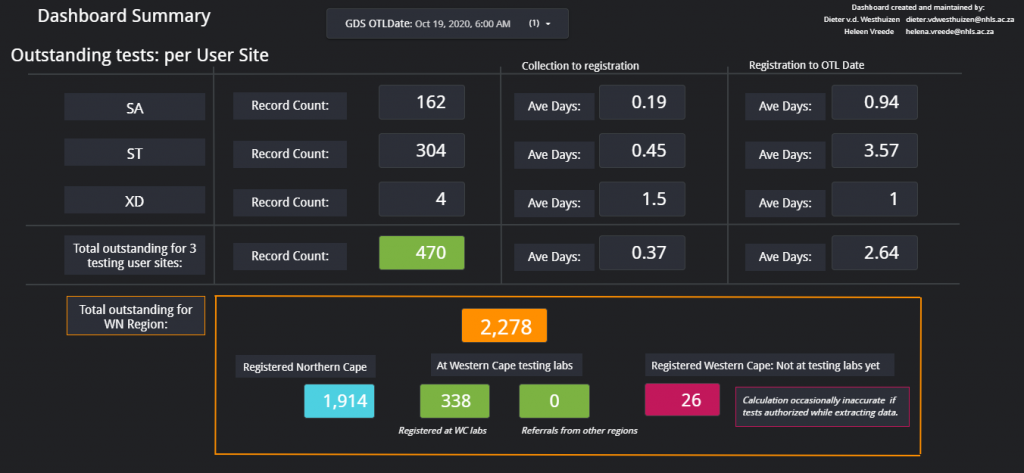
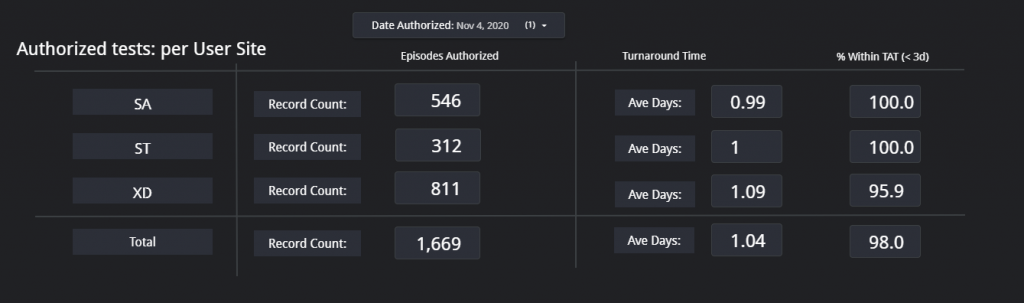
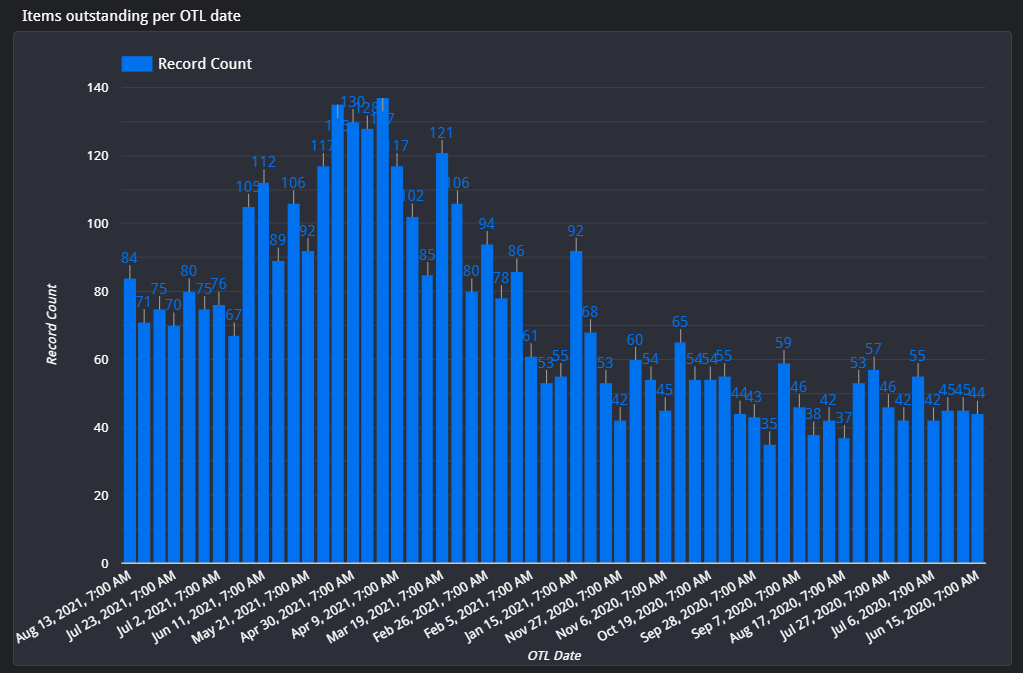
6. COVID OTL Dashboard – During the first COVID Lockdown most of the COVID PCR labs in South Africa were swamped with samples and couldn’t easily keep up with the testing volume. The Department of Health needed info of the back log of samples to be tested. Additionally, the Western Cape Area manager needed information of where the hold-up of samples were in the province. I was contacted as I had some (albeit limited) experience with databases and dashboards. The aim was to make a dashboard which could effectively track delayed samples, count them between centres and also determine where possible hold-ups were. With Dr. Heleen Vreede we set up automated data extractions on TrakCare (every 12 hours at 07h00 and 19h00) and made it such that the data extractions could be loaded onto a Google Sheets Database where Google Data Studio would get the data to calculate the respective counts and average outstanding times. This was done for the 3 COVID testing laboratories in the Western Cape at the time: Groote Schuur Hospital laboratory, Tygerberg laboratory and Green Point laboratory. There were various functions and calculations in this dashboard, with 4 large tables in a database. The dashboard also had various pages, each of which could be used for a specific query. Although not entirely focussed on Chemical Pathology, this project has learned me much about data science in general. As an example, two screenshots of the first page are shown below. The dashboard can be viewed at: WC OTL Dashboard – tinyurl.com/COVID-WC-OTL
Summary Dashboard 1 – Outstanding test items per testing user site.Summary Dashboard 2 – Turnaround time for COVID samples at each of the 3 testing user sites, SA (Groote Schuur Laboratory), ST (Tygerberg Laboratory), and XD (Green Point laboratory).
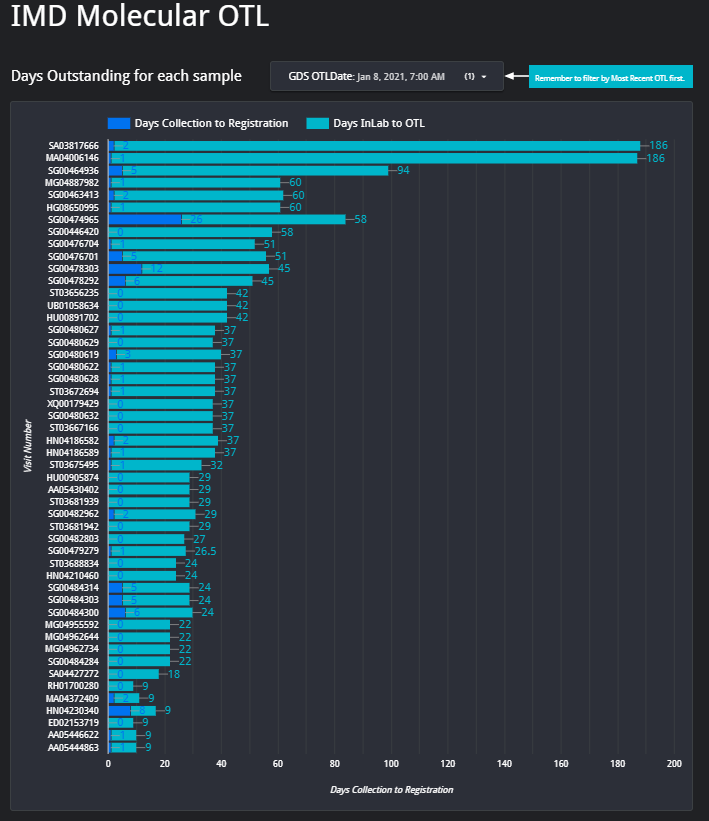
7. IMD OTL Dashboard – From above Dashboard, I was then approached by Surita Meldau, our IMD Genetics Laboratory Head to assist with the IMD Genetics’ lab OTL’s to try come up with a solution to easily track the most outdated samples for the planning of which samples to prioritize each week. We then implied the same principles of above COVID dashboard, into this IMD OTL Dashboard. The result was an interactive portal where we can view information such as patient name, surname, requesting hospital and type of genetic test, all on one platform. The reports are not generated 12-hourly as in the COVID dashboard, but weekly every Friday morning.
8. Transcribing results to TrakCare from CSV in an automated way – With the rapid ramp-up of COVID PCR and antibody testing, there were a few problems initially, which ranged from TrakCare database problems when the new test sets were created, billing problems and analyzer-to-LIS-interface problems. A few times I needed to assist with a few thousand results which needed to be removed and re-tranmitted or entered onto TrakCare. Soon I wrote a script which we could run on a computer, and later on a few computers at once to do the data entry onto TrakCare in an automated way from a CSV results file. This script has no SOP, but is hosted on Github is the need arrises again to use it. It is customized to the applicability at every instance.
Section 7.4 – Method Verification
Introduction
A new analyzer (Diasorin Liaison) was aqcuired by the Virology Department at GSH.
In summary: since the Diasorin Liaison has the capability to do various chemistry analyses too, we were able to “piggy back” on the analyzer’s acquisition and install / setup various chemistry analytes too.
We have decided to introduce:
Aldosterone
Renin
IGF-1
Growth Hormone
C-peptide
I was given the task to specifically concentrate on aldosterone as method verification.
Points which will be discussed:
Rationale for implementation of Aldosterone and Renin
Medical decision limits
EP15-A3: 5×5 method for precision (and accuracy) determination
Method comparison study
Rationale for implementation of Aldosterone and Renin
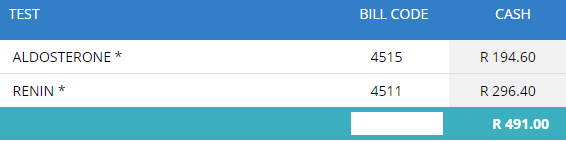
Our previous practice was to send aldosterone and renin results to a private laboratory (PathCare).
Table 1 – price for both assays at Pathcare. According to the service level agreement between the NHLS and Pathcare, tests are billed cheaper at a fixed rate, but this is a bulpark of the cash price billed as per Pathcare web site (url: https://www.pathcare.co.za/fee-lookup-2/ , accessed 22/04/2021).
Virology had planned to budget for a new analyser to run a few of their Virology serology assays. Their test volumes, for the assays on their analyser hasn’t been high enough to adequately motivate for this new analyser.
The auto-analyser which we use (Roche COBAS 6000), doesn’t have a repertoire of Aldosterone and Renin.
Since we had already sent roughly 30 samples for both aldosterone and renin to Pathcare per month, this was a great opportunity to partner with the Virology department in a mutual tender for an instrument which could run their serology assays and our Aldosterone and Renins. Additionally we added some other tests to the repertoire for tender of tests which we were also sending to Pathcare: IGF-1 and hGH.
Together with the anticipated virology serology tests, the total test volume was such that we could motivate to the business manager at GSH for a “break-even” scenario with regards to Cost vs. Income.
The tender was then awarded to the company supplying the Diasorin Liason analyser (as a placement option for 5 years), upon which I was given the task of doing the method verification for aldosterone.
The prior CLSI EP15 A2 document described the following:
Clinical and Laboratory Standards Institute (CLSI) document EP05-A2 describes the protocols for determining the precision of a method. The precision of a method should be tested at at-least two levels; each run in duplicate, with two runs per day over 20 days. It also describes the protocols that should be undertaken by the user to verify precision claims by a manufacturer. Precision claims by a manufacturer should be tested at at-least two levels, by running three replicates over five days.
Excerpt – CLSI EP15 A2 2
Medical decision limits
The medical decision limits chosen were:
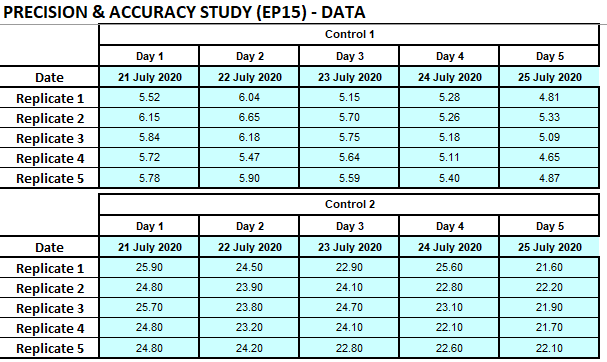
EP15-A3: 5×5 method for precision (and accuracy) determination
In the NHLS, a method verification currently happens according to guidelines as per CLSI EP15-A3 document: “User Verification of Precision and Estimation of Bias” provides a simple experimental approach to estimate a method’s imprecision and bias. 1
The objective is to determine if the laboratory precision performance of repeatability and within-laboratory imprecision are in accordance to the manufacturer specification claims.
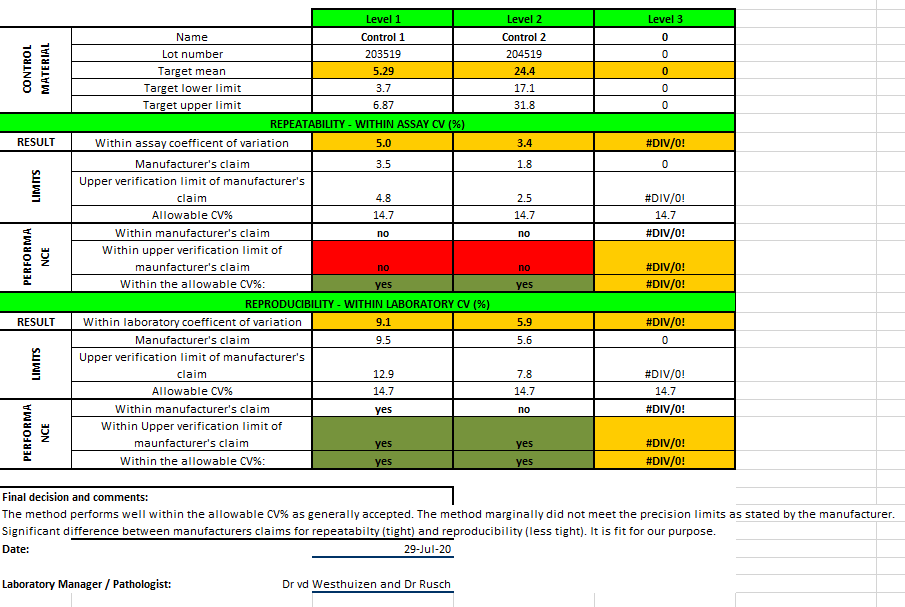
Aldosterone was performed on the Diasorin Liason. One QC lot was obtained for QC of the assay after maintenance and another QC lot (with a different assigned value) was used as the testing material. Quality control (QC) levels (L1: 5.25; L2: 21.10 ng/dL) (Bio-Rad Laboratories, Irvine, CA) were used. Each QC level was measured before and after instrument. Five replicates of the testing material was done per run, one run per day, and during 5 days. Imprecision estimates were calculated by one-way analysis of variance using Microsoft Excel on a template sheet developed previously by Dr Fierdoz Omar. Estimated imprecision was compared to the manufacturer’s stability claims and desirable imprecision specifications based on biological variation.
The aldosterone assay was found “fit for purpose” although not meeting all the manufacturer’s claims.
The literal description of “fit for purpose”: (of an institution, facility, etc.) well equipped or well suited for its designated role or purpose.
This assay, even though not meeting the manufacturer’s claims, performs well within the published “Desirable Analytical Quality Specifications for Imprecision, Bias and Total Error Upon Biological Variation”.
In the process of this project and every day IQC, I have also developed an interactive portal with the desirable analytical quality specifications as per Ricos et al.: TEa Dashboard
References
Jose Jara Aguirre, MD, Karl Ness, MLS, Alicia Algeciras-Schimnich, Application of the CLSI EP15-A3 Guideline as an Alternative Troubleshooting Tool for Verification of Assay Precision, American Journal of Clinical Pathology, Volume 152, Issue Supplement_1, October 2019, Page S88, https://doi.org/10.1093/ajcp/aqz117.007
Desirable Analytical Quality Specifications for Imprecision, Bias and Total Error Upon Biological VariationDerived from Ricos C, Alvarez V, Cava F, Garcia-Lario JV, Hernandez A, Jimenez CV, Mininchela J, Perich C, Simon M. “Current databases on biologic variation: pros, cons and progress” Scand J Clin Lab Invest 1999;59:491-500. Updated from data made available in 2014.Source: https://www.qcnet.com/Portals/0/PDFs/BVValues1Final.pdf
Section 7.3 – Audit
The following poster has been presented at a Congress Pathcape in 2018 as a result of this audit. It also summarizes the work that has been done.
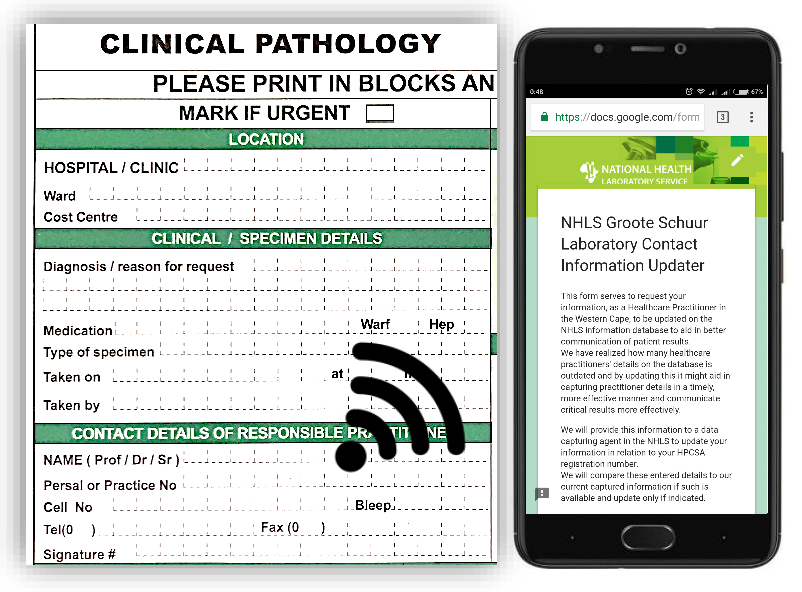
Is an updatable online database of clinician contact details the answer?
DJ van der Westhuizen, J Cole, R Dalmacio, EJ Gantana, JA Rusch, HW Vreede Division of Chemical Pathology, University of Cape Town & Groote Schuur Hospital, National Health Laboratory Services
Background
As a result of omission of contact details on laboratory request forms, laboratory personnel frequently spend excessive time attempting to reach responsible clinicians regarding patient results. Poor completion of request forms was previously established in our laboratory as well as at the nearby Tygerberg Hospital NHLS.1 An online web form was created in our laboratory that allows clinicians to update the contact details linked to their professional registration number
Objective
This audit is intended as a proof of concept that the proportion of clinicians that are readily contactable would significantly increase should a system that links professional registration numbers with valid contact details be implemented.
Method
All request forms for the Core Laboratory of Groote Schuur Hospital (encompassing chemistry, haematology, immunology and virology) over a two-day period were scrutinised to determine the proportion of clinicians that provided their contact details and HPCSA registration numbers. The completeness of other clinically and analytically relevant fields was also recorded. Request forms received from all hospitals and clinics in our catchment zone were included.
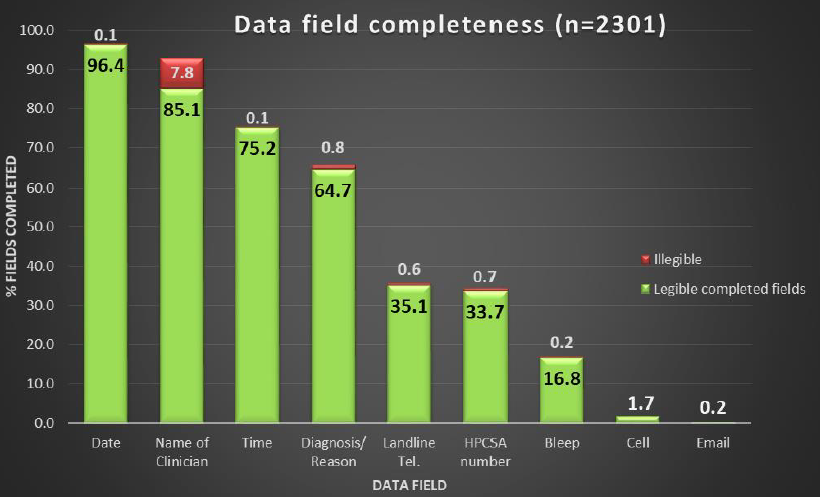
Results
A total of 2301 forms were analysed.
Personal contact – and pager numbers were absent on 81.6% of forms.
The ward or clinic contact number was absent on 64.3% of forms.
Of the 34.4% of forms which exhibited an HPCSA registration number, 41.1% lacked a personal contact number and pager number.
Of all forms from local clinics, 46% provided no contact number.
Specimen collection time was absent in 24.7% of forms.
Collection date was absent in 3.5% of forms
Clinical details was absent in 34.5% of forms.
Conclusions
The vast majority of clinicians do not provide personal contact details for the communication of critical laboratory results. This audit illustrates that a significant improvement may be made were clinicians able to maintain their contact details on an online form that links these details with their professional registration number. Such a form has been created and awaits approval by the NHLS executive. Should it be approved, it will be made available to clinicians in the Western Cape who are served by the NHLS. After sufficient time has elapsed, an audit can be undertaken to monitor the effect of this intervention.
References
1. Nutt L, Zemlin AE, Erasmus RT. Incomplete laboratory request forms: the extent and impact on critical results at a tertiary hospital in South Africa. Annals of clinical biochemistry. 2008 Sep;45(5):463-6.
Section 7.2 – Research Involvement
Research involvement by candidate
MMed Research Project Title: An HPLC-based method development for GFR determination using Iohexol clearance Involvement: This project is one of the three examination components of the MMed degree and is a requirement for registration as a specialist with the Health Professionals Council of South Africa (HPCSA). The work must be done independently by the candidate, under the guidance of his/her supervisor. The candidate must demonstrate an ability to undertake research, to read and review literature comprehensively and critically, and to analyse results adequately. The outcomes of the research must be written up in the form of a publication-ready article or a monograph. Details of Project: Please see Section 7.6 – Research proposal.
COVID-19 Related Laboratory Analyte Changes and the Relationship between SARS-CoV-2 and HIV, TB and HbA1c in South Africa. We conducted a retrospective analysis on data of all adults tested for SARS-CoV-2 across our laboratory network in South Africa over a 4-month period. Details of Project: Please see Section 7.1 – Publications by Candidate
Acute Kidney Injury during the COVID-19 Pandemic – Experience from Two Tertiary Centres in South Africa. The aim of this study was to describe the prevalence of acute kidney injury (AKI) in hospitalized patients with COVID-19 in two tertiary centres in SA. Patients admitted to two tertiary centres in SA between 18 March and 31 August 2020 were included in the study. Demographic data, pre-existing comorbidities, admission variables, laboratory data, management and hospital outcomes were captured. Outcomes assessed were the need for acute dialysis, recovery from AKI, discharge and death. I was responsible for extracting and filtering the data from the Groote Schuur Hospital’s admitted patients. I was also responsible for analysing the data for the Groote Schuur Hospital patients. Details of Project: Please see Section 7.1 – Publications by Candidate
COVID Outstanding Test List (OTL) Dashboard The aim of this project, even though not technically a research project as such, but more a data science project, was to create a real-time dashboard, during the heat of the onset of the COVID-19 pandemic, to enable the Virology Department, as well as the COVID Expert Committee to track the outstanding tests in various parts of the Western Cape, as they were referred. This dashboard was updated twice per day, at 6am and 6pm daily, and provided detailed information which could be used to advise area, business, and laboratory managers on the possible locations / bottlenecks in the COVID PCR test process. Details of Project: Please see Section 7.8 – COVID OTL Dashboard or see it in Real-time on Google Data Studio
Variability of the serum electrolytes Calcium, Magnesium And Phosphate in patients With Severe COVID-19 disease (ongoing project) Observations were made that in many COVID-19 cases individual patient’s serum calcium, magnesium and/or phosphate (CMP) results were highly variable. This within-subject variation (CVw) was noted to be vastly in excess of normal biological variation (BV). In some cases for example, phosphate levels exceeded both the upper and lower reference interval within periods as short as 24 hours. Serum CMP results were extracted for adult patients tested positive for SARS-CoV-2 from March 2020 until March 2021 using data as part of routine management. In this project I have used a data extraction script by means of a web scraping technique which I have learned throughout my time as registrarship.
Acute Kidney Disease Incidence in South Africa (ongoing project) The national laboratory services database will be accessed to determine the incidence of AKI in people who have had their renal function checked in South Africa over a ten year period. Patients with impaired renal function will have follow up data assessed to determine if there is an acute element to the renal dysfunction. Should there be renal dysfunction requiring hospital admission the creatinine on admission will be documented. Any prior creatinine will be documented and subsequent creatinines will be reviewed to determine if there was any form of renal impairment on admission or during the hosital stay. In order to differentiate between acute and chronic renal disease a large data set is required to determine the markers. Follow up renal function will be recorded, along with referral to the Renal Service either as an in patient or an outpatient. Follow up creatinine and outcomes will be determined up to one year. Type of admission (medical, surgical, obstetric) will be assessed to determine departmental incidence. The data accessed will be to determine incidence of AKI. The data will be accessed as anonymous data and will be stored on password protected computers. Only the clinicians involved in the study will have access to the data. These data will allow us to determine the trend of acute kidney disease in the last ten years.
Inherited Metabolic Disease Audit at Red Cross Children’s Hospital laboratory (ongoing project) The aim of this project is to describe the inherited metabolic diseases detected at the Red Cross Metabolic laboratory over the last 14 years. A data extraction has been performed on all urine organic acid profiles reported from 2007 to 2021. This dataset includes roughly 18 000 reported urine organic acid profiles, which will be classified into their respective diagnoses.
Creation of a lysis buffer for COVID PCR tests The aim of this project – although not published or written up as such – was to attempt to create a suitable viral lysis buffer for RNA extraction upon the heat of the COVID pandemic in 2020. South Africa had just gone into lockdown and some of the reagents, one of which was the viral lysis buffer, which is used to lyse the viral lipid bilayer to expose the RNA for extraction, had neared the last or so batch and no commercial buffer could be obtained. I created an “expect group” in our centre, where we brain-stormed ideas, collated expert opinions and I set off to create our very own RNAse-free lysis buffer with a suitable surfactant and the works. The virology registrars tested this compared to the commercial extraction buffer which was still available and according to them it performed similarly, without much difference. They were barely able to observe a Ct-value difference in the tested samples, indicative of extraction efficiency. Luckily the supplier was able to obtain the commercial reagent again, which meant our unverified reagent was left on the shelf where it likely will stay until the next lockdown.
ORCHID Study I am involved often in advising prospective researchers on particulars about laboratory tests and ensuring tests are done as best intended. We also try to assure that the pre-analytical factors are put in place to ensure quality results. In this study, which is titled: Obesogenic origins of maternal and child metabolic health involving dolutegravir (ORCHID), I have advised on various aspects where results may be affected: hemolysis which falsely decreases insulin, dilutions possible with our measurement method of C-peptide and measuring limits have been clearly explained.
Section 7.1 – Publications by Candidate
COVID-19 Related Laboratory Analyte Changes and the Relationship between SARS-CoV-2 and HIV, TB and HbA1c in South Africa
Reinhardt Hesse, Dieter van der Westhuizen, Jaya George
We conducted a retrospective analysis on data of all adults tested for SARS-CoV-2 across our laboratory network in South Africa over a 4-month period. Out of 842,197 tests 11.7% were positive and 88.3% negative. The prevalence of HIV was 6.25 and 6.31% in the SARS-CoV-2 positive and negative cohort respectively (p=0.444). However, the prevalence of HIV positive individuals in the critical cohort (9.15%) was higher than in the non-critical group (6.24%) (p=0.011). Active tuberculosis infection was approximately 50% less in SARS-CoV-2 positive than in negative individuals. The prevalence of uncontrolled diabetes was 3.4 times higher in SARS-CoV-2 positive cases, but was not higher in the critical vs. non-critical cases (p=0.612). The neutrophil-to-lymphocyte-ratio, coagulation markers, urea, cardiac, and liver related analytes were significantly elevated in the critical compared to non-critical cases. Platelet count and creatinine concentration did not differ significantly between the two groups. These findings do not support increased prevalence of HIV or tuberculosis in individuals with SARS-CoV-2 infection but do suggest an association of increased disease severity with HIV positive status. Uncontrolled diabetes was positively associated with a significantly higher prevalence of SARS-CoV-2 and our investigation into analyte changes associated with SARS-CoV-2 disease severity supported previous findings of raised inflammatory markers, coagulation markers, liver and cardiac related analytes and urea, but not for creatinine and platelet count.
Acute Kidney Injury during the COVID-19 Pandemic – Experience from Two Tertiary Centres in South Africa
Nina E. Diana, Ismail S. Kalla, Nicola Wearne, Sarah Kariv, Bianca Davidson, Jody Rusch, Zibya Barday, Abid M. Sheikh, Samantha Reiche, Farzahna Mohamed, Sara Saffer, Chandni Dayal, Jacqueline P. Venturas, Jarrod M. Zamparini, Dieter van der Westhuizen, Sean Wasserman, Nectarios Papavarnavas, Linda Boloko, Timothy de Wet, Graham Paget, Adam Mahomed, Sagren Naidoo and Erika S.W. Jones
Background: The first case of SARS-CoV-2 in South Africa [SA] was documented in March 2020. By October, the total cases for the Western Cape and Gauteng Provinces were 331,425 with 8456 fatalities. The aim of this study was to describe the prevalence of acute kidney injury [AKI] in hospitalized patients with COVID-19 in two tertiary centres in SA. Methods: SARS-CoV-2 positive patients admitted to two tertiary centres in SA between 18 March and 31 August 2020 were included in the study. Demographic data, pre-existing comorbidities, admission variables, laboratory data, management and hospital outcomes were captured. Exclusion criteria included age <18 years, pre-existing Stage 4 or 5 chronic kidney disease and prior renal transplant. Outcomes assessed were the need for acute dialysis, recovery from AKI, discharge and death. Results: AKI occurred in 374/1102 (33.9%) patients admitted to the two hospitals. Within the AKI cohort, 91 (24.3%) patients required intensive care unit [ICU] management, and 32 (8.6%) received kidney replacement therapy. Older age (P = 0.001), pre-existing hypertension [HPT] (P = <0.0001) and biochemical evidence of severe disease, including high ferritin, lactate dehydrogenase, d-dimer and C-reactive protein, were significantly higher in the patients with AKI versus those without. AKI Stage 3 had a higher mortality and lower rates of renal recovery upon discharge. AKI was significantly associated with an increased utilization of ICU resources, prolonged length of stay and mortality. Conclusion: This study reports the largest cohort of COVID-19-associated AKI in Africa. Older age, HPT and severe COVID-19 infection were significantly higher in patients with COVID-19 who developed AKI. This cohort had high rates of AKI which was associated with adverse outcomes, including mortality.